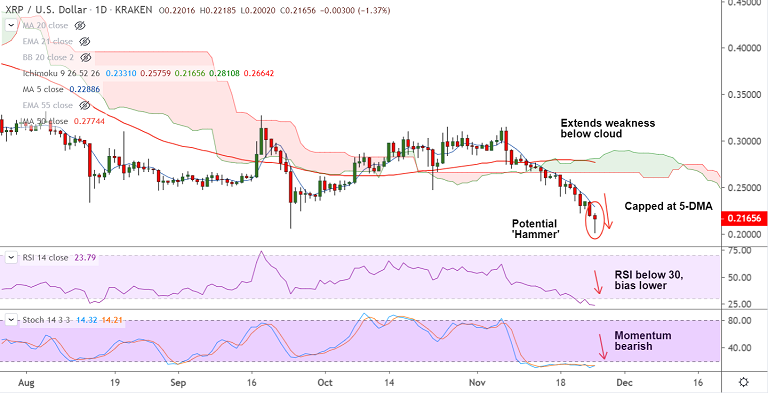
XRP/USD chart - Trading View
Exchange - Kraken
Support: 0.1500 (Sept 2017 low); Resistance: 0.2289 (5-DMA)
Technical Analysis: Bias bearish
XRP/USD has edged higher from multi-year lows at 0.2002, bias remains bearish.
The pair was trading at 0.2180 at 11:00 GMT, down 0.29% at the time of writing.
Technical studies support further weakness in the pair, scope for downside resumption.
That said, a potential 'Hammer' formation at lows raises scope for some consolidation.
5-DMA is immediate resistance at 0.2289. Break above will see gains till 21-EMA at 0.2548.
Major and minor trend have shifted to bearish. Scope for test of Sept 2017 lows at 0.1500.



Bitcoin Bleeds $704M in ETF Outflows as Institutional Exodus Accelerates
FxWirePro: USD/CAD bulls continue to hold the higher ground
FxWirePro- Major Crypto levels and bias summary
ETH Cracks $2,100 in Bitcoin’s Wake as Bearish EMA Stack Deepens; Sellers Target $1,900 on Rallies
Ethereum Tumbles Below $2K: Bears Eye $1,700 as All Key EMAs Flip Red
FxWirePro- Woodies pivot (Major)
FxWirePro: GBP/AUD downside pressure builds, key support level in focus
FxWirePro: GBP/USD edged higher as hopes for US-Iran deal boost riskier assets
Bitcoin Buckles at $73,500: Middle East Tensions and Weak Institutional Demand Set Bearish EMA Stack on $70K Collision Course
NZD/JPY Breakout Blast: Kiwi Rocket Smashes 94.50 Resistance, Bulls Lock Sights on 95
Pound-Yen Roars Back Above 214: Bulls Reload for 216–217 Charge on Dip-Buying Setup 


