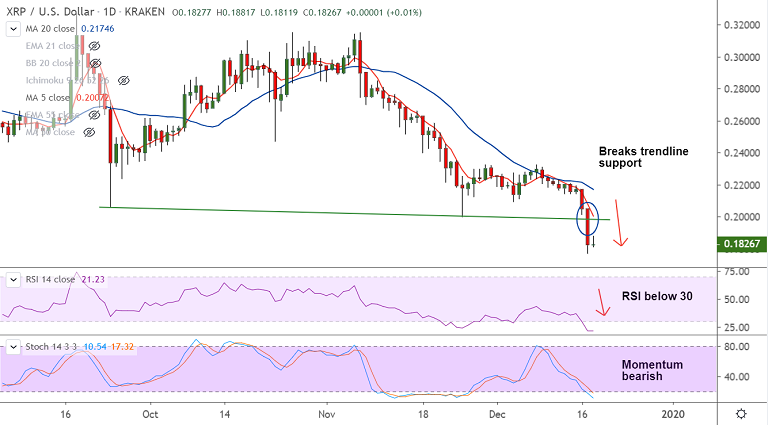
XRP/USD chart - Trading View
Exchange - Coinbase
Support: 0.1500 (Sept 2017 low); Resistance: 0.2009 (5-DMA)
Technical Analysis: Bias Bearish
XRP/USD is consolidating previous session's slump, poised for more downside.
The pair has edged lower from session highs at 0.1881 and was trading at 0.1821, down 0.43% at 07:00 GMT.
Technical indicators are sharply bearish. Recovery attempts lack traction.
Price action is outside of the lower Bollinger band and oscillators are at oversold which might result in some consolidation.
Bias is strongly bearish and dip till 0.1500 (Sept 2017 low) likely in the near-term.
5-DMA is immediate resistance at 0.2007. Decisive break above 21-EMA required for change in near-term dynamics.