


 GBPJPY Bullish Surge: Strong Pound Ignites Fresh Upside on Fed-BOE Policy Divergence as All EMAs Align
  FxWirePro: GBP/USD hits one-month high, scope for further upside
  ETHUSD Bullish Momentum: Follows BTC Above All EMAs, Buy Dips Near $1750 Targeting $2300
  FxWirePro- Woodies pivot (Major)
  Gold Loses Steam After Strong U.S. Retail Sales
  FxWirePro: USD/CAD falls after BoC rate hold and weak U.S. producer inflation
  ETH Stands Alone Bullish; BTC, SOL, XRP, BNB Neutral


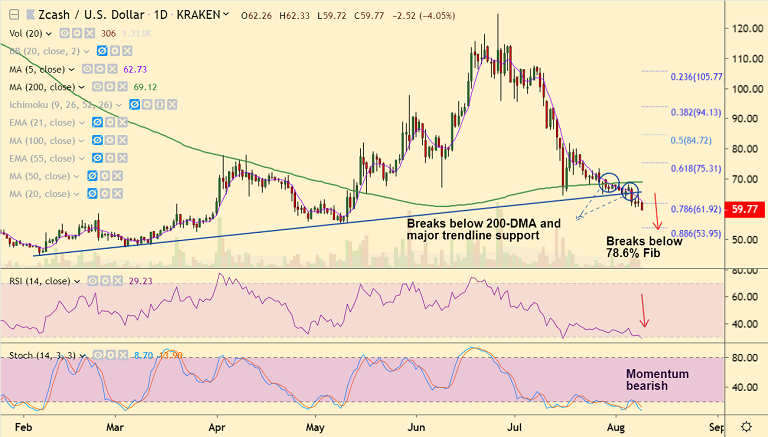
ZEC/USD chart - Trading View
Exchange - Kraken
Support: 53.95 (88.6% Fib); Resistance: 69.12 (200-DMA)
Technical Analysis: Bias Bearish
ZEC/USD was trading 3.72% lower on the day at 59.97 at 10:00 GMT, bias is bearish.
'Gravestone Doji' on previous day's candle shows selling pressure at highs, plummets prices.
GMMA indicator and the Parabolic SAR suggest extension of downtrend. Momentum studies are bearish.
The pair has slipped below 78.6% Fib and eyes next major support at 55.24 (May 9th lows) ahead of 88.6% Fib at 53.95.
5-DMA is immediate resistance at 62.76. Retrace above 200-DMA (69.12) negates near-term bearishness.


