Home / Technicals / Article Technicals
Add as a preferred source on Google DXY:2618 trade setup Chart pattern formed- Double top Major resistance- 96 DXY has declined till 95.15 (100 4H EMA) and started to jump from that level. It is currently trading around 95.61. The major intraday resistance is 95.67 (61.8% retr…
By FxWire Pro Jun 3, 2016, 11:40 AM UTC
Image from the original EconoTimes article Read the original article
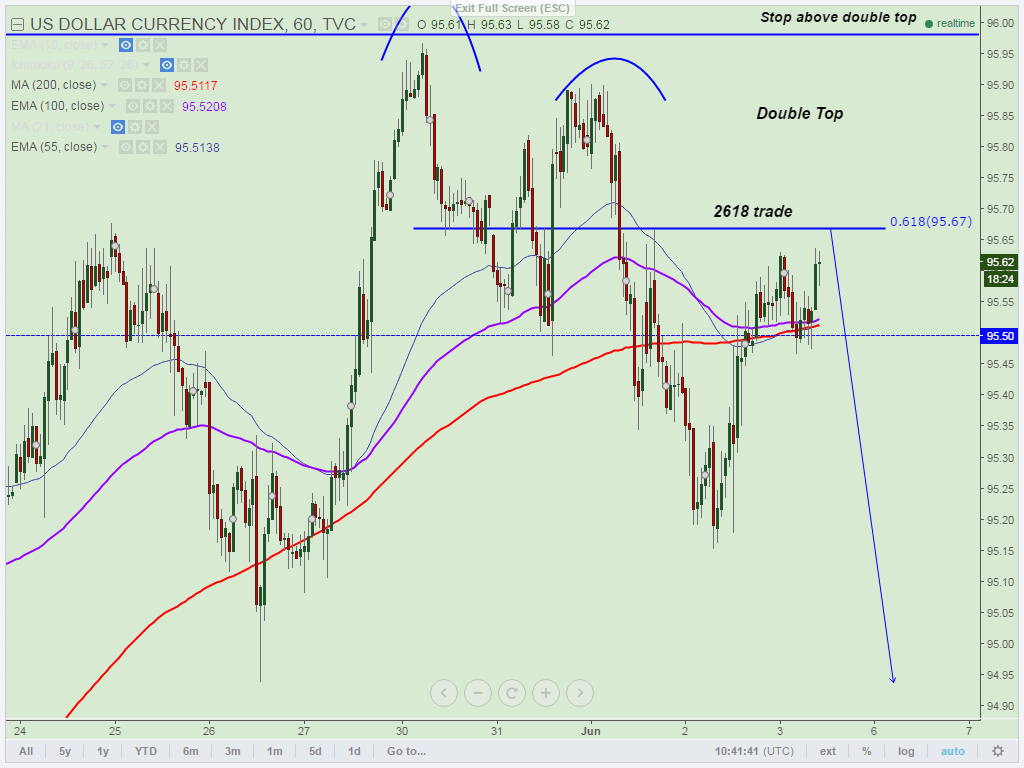
Chart pattern formed- Double top
Major resistance- 96
DXY has declined till 95.15 (100 4H EMA) and started to jump from that level. It is currently trading around 95.61.
The major intraday resistance is 95.67 (61.8% retracement of 95.97 and 95.15) and any break above targets 96/96.40 in short-term.
Short term trend is still weak as long as resistance 96 holds.
On the lower side major support is around 95.15 and any break below targets 94.80/94.10 in short-term.
It is good to sell at 95.60-95.65 with SL around 96 for the TP of 95.15/94.80/94.20
Technicals EURUSD - Levels to watch - 1.1100 GBPUSD Levels to watch - 1.3180 USDCHF Levels to watch - 0.8365 USDCAD - Levels to watch - 1.4300 AUDUSD - Levels to watch - 0.7000 NZDUSD - Levels to watch - 0.5560
By FxWirePro Team Oct 15, 2026, 3:20 AM UTC
Technicals EURUSD - Levels to watch - 1.100 GBPUSD Levels to watch - 1.3180 USDCHF Levels to watch - 0.8400 USDCAD - Levels to watch - 1.4300 AUDUSD - Levels to watch - 0.7000 NZDUSD - Levels to watch - 0.5560
By FxWirePro Team Oct 15, 2026, 3:17 AM UTC
Technicals JPY Major Pair Currency Score: USDJPY, GBPJPY and AUDJPY Extremely Bearish
By FxWirePro Team Oct 15, 2026, 2:34 AM UTC