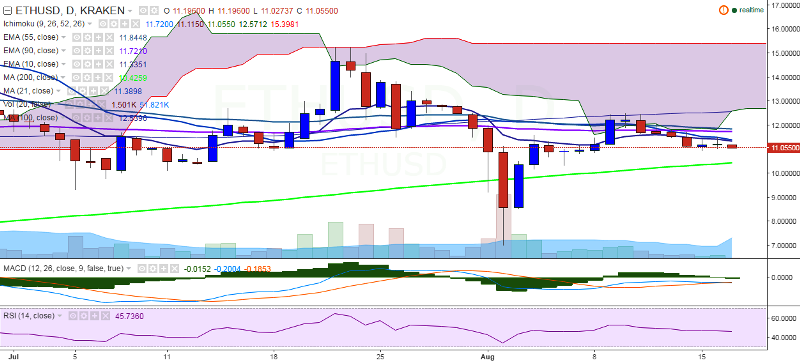
ETH/USD continues to trade flat on Wednesday, trying to hold its strength above the 11.00 mark. It currently trades at 11.05 levels at the time of writing (Kraken).
Ichimoku analysis of daily chart:
Tenkan Sen: 11.67
Kijun Sen: 11.11
Trend reversal: 11.73 (90 EMA)
The pair is trading below 21-day MA and must close above this level for further bullishness. On the top side, the pair will run into resistance at 11.48 (21 MA) and any violation will see the pair testing 11.87 (55 EMA)/12.52 (100 MA).
On the reverse side, support is likely to be found at 10.38 (200-day MA) and a break below would drag the pair to 9.09 (61.8% retracement of 7 and 12.49)/7.00.