


 FxWirePro- Major Crypto levels and bias summary
  FxWirePro- Major Crypto levels and bias summary
  FxWirePro- Major Crypto levels and bias summary
  BTC’s Bear Bounce: Sell the Rally Near $66K as Bears Target $59K–$52K Breakdown


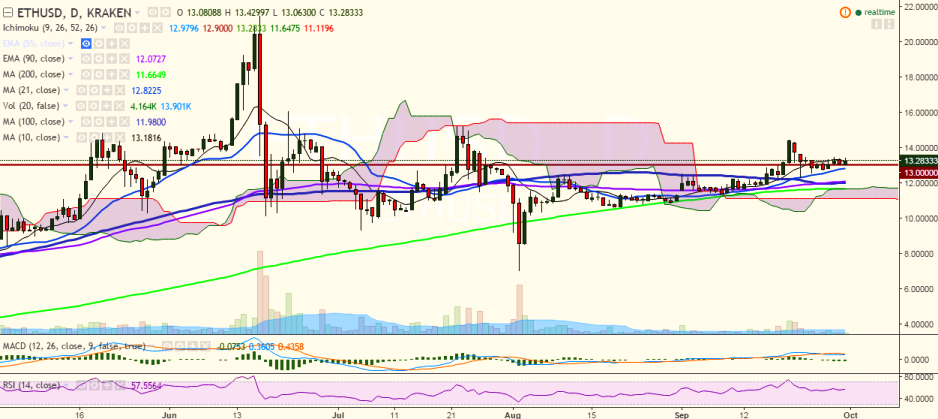
ETH/USD has hit 13.42 levels so far in the day and is trading above 10-DMA. It is currently trading at 13.28 levels at the time of writing.
Long-term trend: Bullish
Short-term trend: Bullish
Ichimoku analysis of daily chart:
Tenkan Sen: 13.31
Kijun Sen: 12.90
Trend reversal: 12.04 (90 EMA)
On the upside, the pair faces immediate resistance at 13.50 (September 28 high) and a break above would see the pair reaching 14.45 (September 20 high)/15.03 (127.2% retracement of 14.45 and 12.30).
On the downside, the pair is trading above the 13.00 mark and seems to have taken support near this level. Any violation would drag it to 12.74 (21 DMA)/12.30 (September 22 low).

- News

- Economy

- Central Banks
- Investing
- Research
- Roundups
- Digital Currency
- Insights
- Technical Analysis
- Technology
- Business
- Law
- Health
- Nature
- Fintech
- Science
- Topic
- Opinions
- ©Econometrics LLC . All Rights Reserved.
ETH/USD takes support at 13, close above 10-DMA targets 14.45
Friday, September 30, 2016 10:22 AM UTC
Editor's Picks


- Market Data
Most Popular


