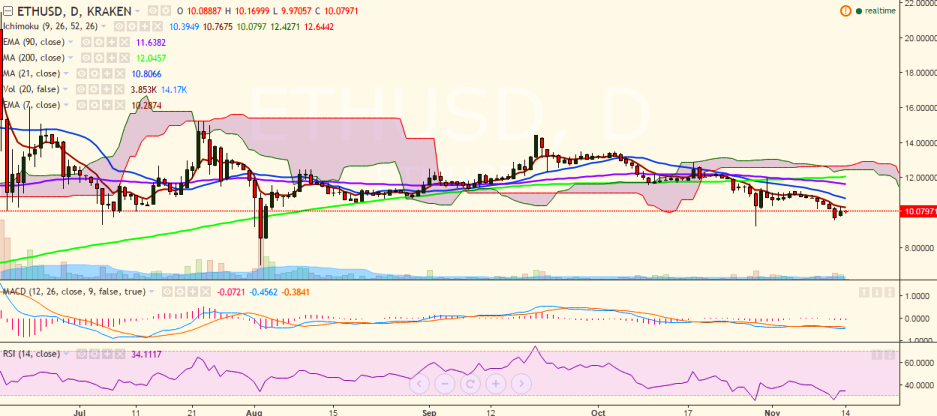
ETH/USD upside capped by 7-EMA, bullishness only above 11.25
ETH/USD is hovering around the 10.00 mark on Monday and is trading in a narrow range between 9.97 and 10.16 levels (Kraken). Short-term trend: Bearish Long-term trend: Bearish Ichimoku analysis (Daily chart): Tenkan-Sen:…
ETH/USD is hovering around the 10.00 mark on Monday and is trading in a narrow range between 9.97 and 10.16 levels (Kraken).
Short-term trend: Bearish
Long-term trend: Bearish
Ichimoku analysis (Daily chart):
Tenkan-Sen: 10.40
Kijun-Sen: 10.95
Trend reversal: 11.67 (90 day MA)
After trading in the red for past couple of days, the pair turned green on November 13 as it closed at 10.12 levels. The upside is currently being capped by 10.35 (7-EMA) and a close above this level would target 10.89 (21-day MA)/11.24 (November 05 high).
On the flipside, support is seen at 9.56 (November 12 low) and a break below would weaken the pair to 9.23 (Oct 29 low)/9.00.
The $0.131 mark was the late-September high; a revisit would depend on Bitcoin (BTC) strengthening and crypto-market sentiment improving. No timeframe was given.