


 FxWirePro: NZD/USD trades in narrow range ,outlook bullish
  GBPUSD, AUDUSD & NZDUSD Turn Extremely Bullish: Strong Positive Momentum Drives Major Pair Action Bias
  FxWirePro: USD/JPY uptrend loses steam, remains on bullish path
  ETH Stands Alone Bullish; BTC, SOL, XRP, BNB Neutral
  NZDJPY Bullish Surge: Strong Kiwi Ignites Fresh Upside as 94 Support Holds and All EMAs Align
  GBPJPY Bullish on Consolidation: Holds Above 216 After 218 Top – Buy Dips at 217 Targeting 220
  FxWirePro: NZD/USD steadies around 0.5830,retains bid tone
  FxWirePro :USD/JPY bulls loosen their grip a bit, dips to be bought
  FxWirePro: EUR/AUD outlook weaker on renewed downside pressure
  FxWirePro:EUR/NZD dips below lower range, bearish bias increases
  FxWirePro: GBP/NZD gains some upside momentum but still bearish
  GBPJPY Bullish Surge: Strong Pound Ignites Fresh Upside on Fed-BOE Policy Divergence as All EMAs Align
  FxWirePro- Major Crypto levels and bias summary
  JPY Action Bias: Extremely Bullish Surge Ignites Across NZD, GBP & AUD
  FxWirePro- Major Pair levels and bias summary


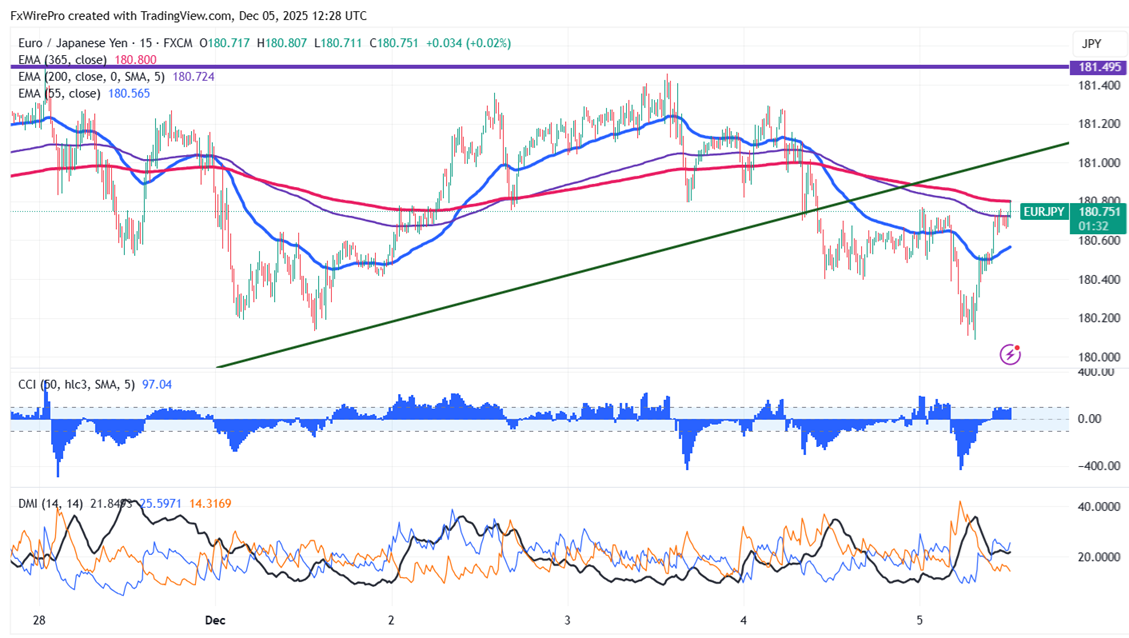
EURJPY has formed triple bottom around 180.20 and showed a minor pullback. Intraday is bullish as long as support 180 holds. With an intraday high of 180.80, it now trades at about 180.807.
Technical Analysis:
The EUR/JPY pair is trading above 55 EMA, 200, and below 365-H EMA on the 15-minute chart.
- Near-Term Resistance: Around 180.80, a breakout here could lead to targets at 181.55/182/182.62/183/185.
- Immediate Support: At 180, if breached, the pair could fall to 179.70/ 179.20/178.90/178.40/178/177.25/176/175.20.
Indicator Analysis (15-min chart): - CCI (50): Bullish
- Average Directional Movement Index: Bullish
Overall, the indicators suggest a bullish trend
Trading Recommendation:
It is good to buy on dips around 180.48-50 with a stop loss at 180 for a TP of 182/183.


