


 Goldman Sachs: US Dollar Likely to Stay Strong Despite Oil Price Retreat
  Bank Regulation Rollbacks in the U.S. and UK Could Increase Financial Risks, Study Warns
  SpaceX Stock Gets $175 Target as Analysts See Massive Growth Ahead
  China’s AI Manufacturing Boom Masks Weak Consumer Economy, Citi Says
  How Donald Trump has changed the way diplomacy is done
  Gold Surges Above Key EMAs, Bulls Eye Resistance Amidst Bullish Momentum
  AI Memory Boom Sparks Global Chip Supply Crunch
  Today’s space race could turn fatal if we don’t agree on new rules
  Gold's 365-Day EMA Streak Since Oct 2023 Faces Its First Real Test at $3,980 — Break or Bounce to $4,140?
  Trump’s Iran Strategy: What Has Been Achieved After Three Months of Conflict?
  J.P. Morgan Sees Potential Vestas Guidance Upgrade Amid Strong Wind Energy Demand


 - EconoTimes)


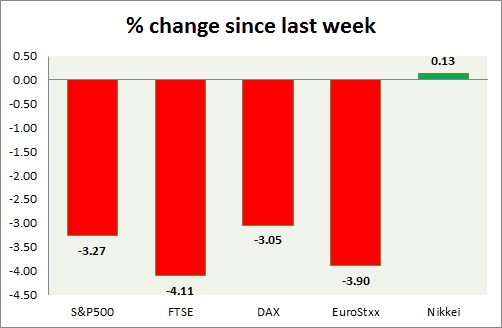
Equities are all red in today's trading. Kindly note all instruments mentioned here are CFDs, whose values might differ from cash or future traded. Performance this week at a glance in chart & table -
S&P 500
- S&P 500 is down sharply over rising risk aversion and key support break yesterday. Today's range 2051-2027.
- S&P 500 future is currently trading at 2031. Immediate support lies at 2065, 2120 and resistance 2020.
FTSE -
- FTSE is sharply down in line with global sell offs. Today's range 6080-6170.
- FTSE is currently trading at 6110. Immediate support lies at 5800, and resistance 6500, 6820
DAX -
- DAX is down after taking resistance at 200 day moving average. Today's range 10820-10600.
- DAX is currently trading at 10680. Immediate support lies at, 10,200, 9850 area and resistance at 11150, 11500 around.
EuroStxx50
- Stocks across Europe are down today.
- German DAX is down (-0.37%), France's CAC40 is down (-0.65%), Italy's FTSE MIB is down (-0.43%), Spain's IBEX is down (-0.65%).
- EuroStxx50 is currently trading at 3350, down by -0.4% today. Support lies at 3200 and resistance at 3550.
Nikkei
- Nikkei is best performer this week so far, only stock market still in positive this week among the discussed. Today's range 19730-19500
- Nikkei is currently trading at 19550, with support around 19500, 18600 and resistance at 20000, 20600.
|
S&P500 |
-3.27% |
|
FTSE |
-4.11% |
|
DAX |
-3.05% |
|
EuroStxx50 |
-3.90% |
|
Nikkei |
+0.13% |


