


 AI Memory Boom Sparks Global Chip Supply Crunch
  Today’s space race could turn fatal if we don’t agree on new rules
  Sell the Bounce": Gold Rally Stalls Near $4165 as Fed Hawks Slam the Door on Rate Cuts — Targets $4000/$3600
  How Donald Trump has changed the way diplomacy is done
  How AI prompting turned writerly description into an everyday skill
  With Iran and the US signing a peace deal, where does that leave Benjamin Netanyahu?
  Gold Surges Above Key EMAs, Bulls Eye Resistance Amidst Bullish Momentum
  China’s AI Manufacturing Boom Masks Weak Consumer Economy, Citi Says
  SpaceX Stock Gets $175 Target as Analysts See Massive Growth Ahead
  Goldman Sachs: US Dollar Likely to Stay Strong Despite Oil Price Retreat
  Morgan Stanley Sees Chinese Auto Market Recovery Gaining Momentum in Late Summer
  Trump’s Iran Strategy: What Has Been Achieved After Three Months of Conflict?


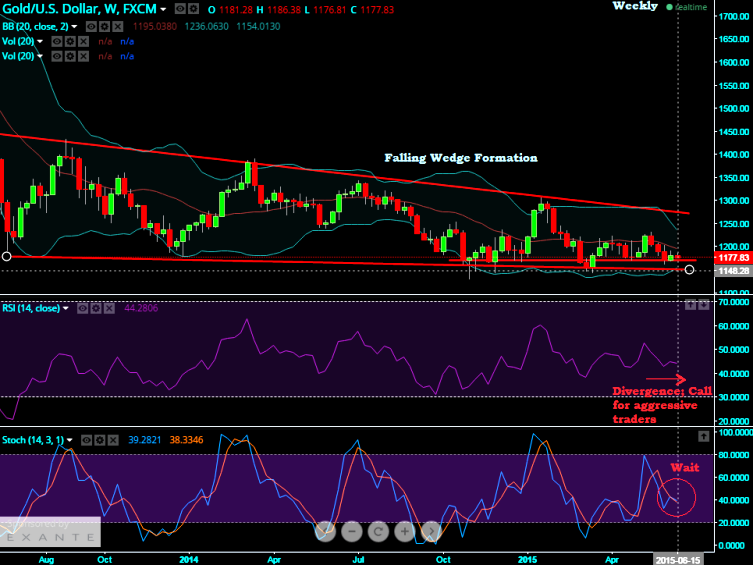
Both on weekly and monthly graphs of this precious metal prices, falling wedge pattern has been spotted out.
Upswings are expected for sure but instant trend reversal still unlikely.
Break below 1175.35 levels can be seen closely when the bulls may gain buying interest at this levels.
The falling wedge is usually a bullish pattern signaling that one is about to witness the price break upwards through the wedge and move into an uptrend.
But at this level our cautious call is to wait patiently for better confirmation that is yet to support and configure from RSI & stochastic indications as well.
Price movements of this commodity has been oscillating between the trend lines as shown in the chart.
The trend lines of this pattern converge with both being slanted in a downward direction as the price is trading in a downtrend.

- News

- Economy

- Central Banks
- Investing
- Research
- Roundups
- Digital Currency
- Insights
- Technical Analysis
- Technology
- Business
- Law
- Health
- Nature
- Fintech
- Science
- Topic
- Opinions
- ©Econometrics LLC . All Rights Reserved.
Expect XAU/USD upswings on Falling Wedge but instant trend reversal unlikely
Monday, June 15, 2015 8:57 AM UTC
Editor's Picks


- Market Data
Most Popular


