


 EUR/USD Holds Bullish Tone Despite Pullback from Yesterday’s High
  GBPJPY Bullish Surge: Strong Pound Ignites Fresh Upside on Fed-BOE Policy Divergence as All EMAs Align
  FxWirePro: GBP/USD under pressure despite UK's modest economic growth
  FxWirePro: EUR/AUD neutral in the near term, scope for downward resumption
  FxWirePro: GBP/USD hits one-month high, scope for further upside
  FxWirePro:EUR/NZD stuck In narrow ranges, focus on near term support
  FxWirePro- Major Crypto levels and bias summary
  FxWirePro: EUR/AUD outlook weaker on renewed downside pressure
  Gold Loses Steam After Strong U.S. Retail Sales
  Crypto Major Pair Action Bias: ETHUSD Bullish as BTCUSD, SOLUSD & XRPUSD Stay Neutral
  FxWirePro: AUD/USD edges lower, but bullish outlook persists


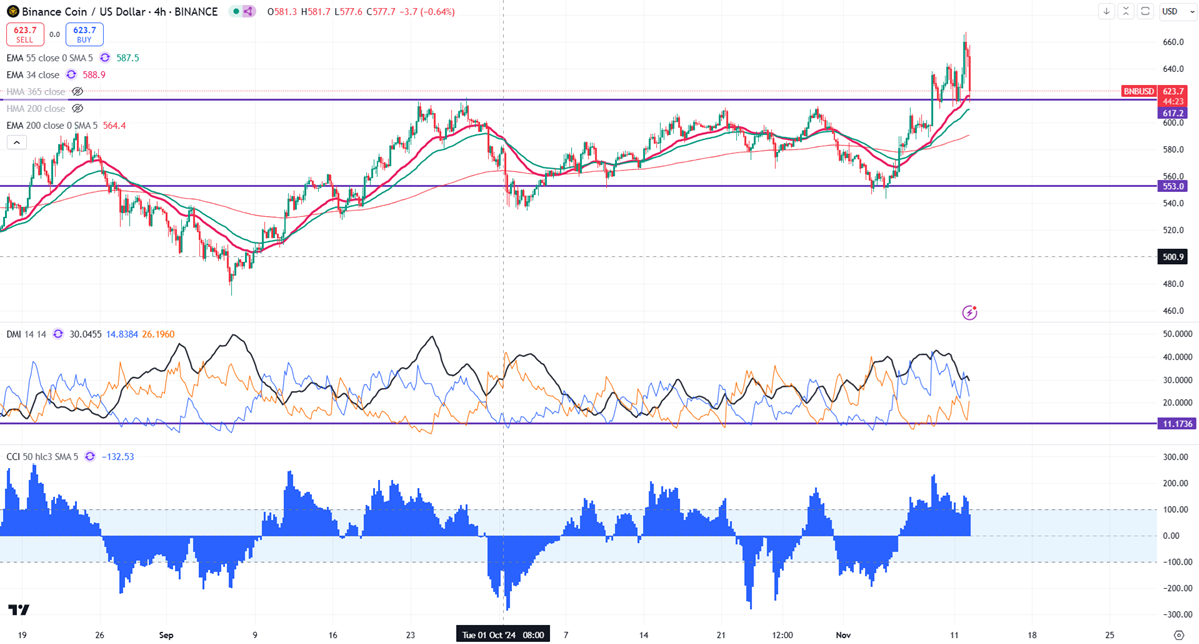
Key Level to Monitor: $545
The BNB/USD pair pared some of its gains after hitting a multi-month high of $667 due to profit-booking. It hit a low of $614 at the time of writing and is currently trading around $625. A closing price below $545 confirms further bearishness.
Intraday bias remains bullish, with prices staying above the 34 and 55 EMA on the 4-hour chart. If the pair closes below $585, potentially leading to further declines towards $559,$545, $528, $500, and possibly down to $470.
Immediate Resistance is at $670. A successful breakout above this resistance could suggest bullish momentum, with further gains possible towards $700/$725.
Indicators (4-Hour Chart)
- Directional Movement Index: Bullish
- CCI (50): Bullish
Trading Strategy
Consider buying on dips around $585, with a stop-loss set at $559 and a target price of $647.


