


 FxWirePro: AUD/ USD eases as risk sentiment remains fragile
  Crypto Major Pair Action Bias: ETHUSD Bullish as BTCUSD, SOLUSD & XRPUSD Stay Neutral
  Major Pair Action Bias: NZDUSD Turns Bullish While Other Majors Stay Neutral
  FxWirePro- Major Crypto levels and bias summary
  FxWirePro: USD/CAD falls after BoC rate hold and weak U.S. producer inflation
  FxWirePro: GBP/NZD downtrend loses steam, remains on bearish path
  JPY Action Bias: Extremely Bullish Surge Ignites Across NZD, GBP & AUD
  JPY Action Bias: CADJPY Turns Extremely Bullish While Other Pairs Hold Positive Ground


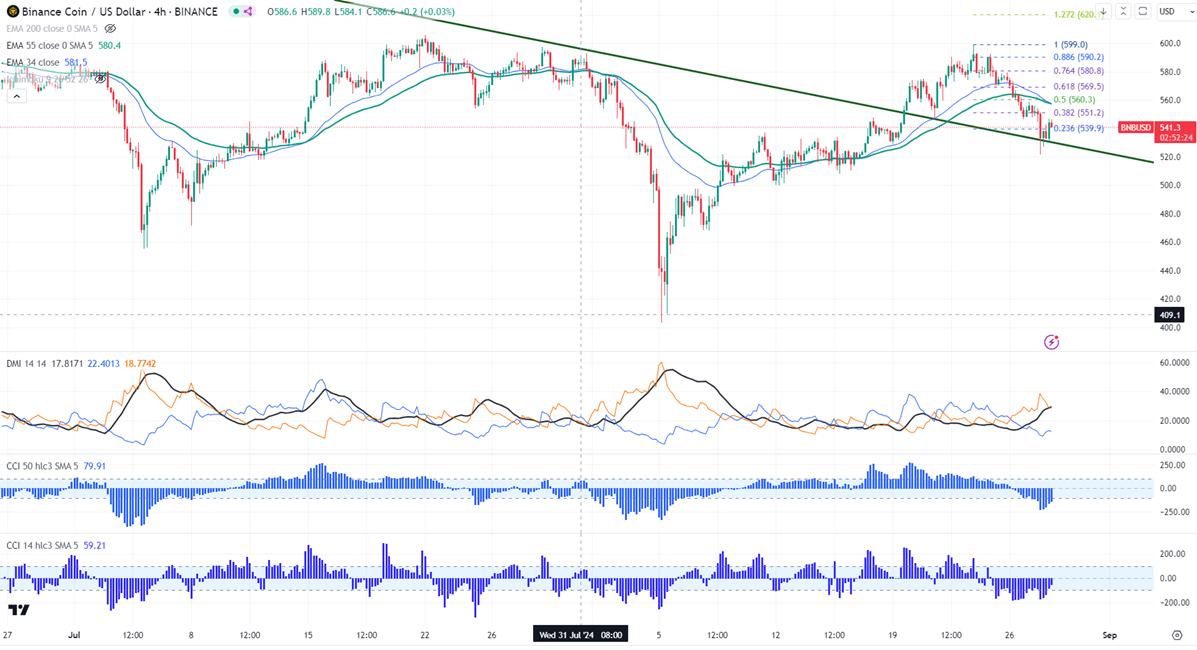
Horizontal trend line- $605
BNBUSD halted its three days of a bearish trend.
Any daily close above $605 confirms further bullishness.
BNBUSD showed a minor pullback from a minor bottom $521.The pair holds well above the short-term (34 and 55 EMA) and long-term moving average in the 4-hour. It hit a high of $546.80 at the time of writing and is currently trading around $543.20.
The bullish invalidation can happen if the pair closes below $400. On the lower side, the near-term support is $519.80 (200-day EMA). Any break below targets$500/$460.
The immediate resistance stands at around $553. Any breach above confirms minor bullishness. A jump to $560/$569/$580/$600 is possible. A surge past $605 will take it to $700.
Indicators ( 4- hour chart)
Directional movement index -Bearish
CCI (50)- Bearish
CCI(14)- Bearish
It is good to buy on dips around $520 with SL around $470 for TP of $605.


