
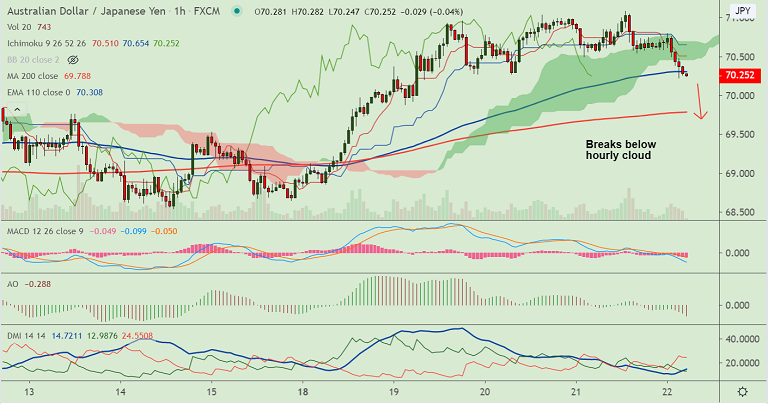
AUD/JPY chart - Trading View
Technical Analysis: Bias Bearish
GMMA Indicator:
- Major Trend: Slightly Bullish
- Minor Trend: Turning Bearish
Ichimoku Analysis:
- Price action in the pair is above daily cloud, but the Chikou Span has turned south
- On the hourly charts, price action has slipped below the cloud
Oscillators:
- RSI has turned south, but holds above 50 mark
- Stochs on verge of rollover from overbought levels
Bollinger Bands:
- Bollinger Bands are wide and volatility is high
High/Low:
- Previous Week High/Low - 70.17/ 68.54
- Previous Session High/Low - 71.08/ 70.49
Major Support Levels: 70.27 (110-EMA), 69.78 (200H MA), 69.42 (21-EMA)
Major Resistance Levels: 70.98 (Upper BB), 72.10 (200-DMA), 72.60 (76.4% Fib)
Summary: Aussie under pressure after Fitch downgraded Australia’s outlook to negative while keeping its AAA rating. US-China tussle could add to downside pressure. Technical indicators on the intraday charts are showing weakness. As price has breached hourly cloud, we see scope for test of 200H MA at 69.78. Watch out for break below 21-EMA for downside continuation.


