
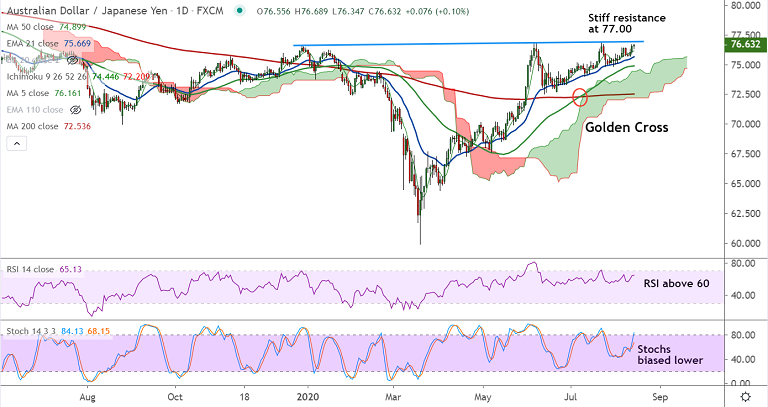
AUD/JPY chart - Trading View
Technical Analysis: Bias Bullish
GMMA Indicator
- Major and minor trend are bullish on the daily charts
- On the weekly charts, minor trend is strongly bullish, while major trend is turning bullish
Ichimoku Analysis
- Price action is above cloud on the daily and weekly charts
- Chikou span is biased higher suggesting continuation of uptrend
Oscillators
- Oscillators are biased higher suggesting bullish momentum
Bollinger Bands
- Analysis of Bollinger bands suggests rising volatility which could carry the pair higher
Major Support Levels: 76.16 (5-DMA), 75.62 (nearly converged 21-EMA and 110W EMA), 74.90 (50-DMA)
Major Resistance Levels: 77.00 (Major Trendline), 78.81 (Upper W BB), 79.90 (200W MA)
Summary: AUD/JPY trades with a bullish bias. Breakout above weekly cloud and 110W EMA supports bullish bias. Major resistance seen at 77.00 (trendline), breakout will propel the pair higher. Scope for test of 78.80.


