


 FxWirePro: AUD/USD dips after RBA Governor speech
  FxWirePro: GBP/NZD downside pressure builds, key support levels in focus
  FxWirePro : USD/JPY holds relatively bid on 163 ahead Of FOMC,BoJ meetings
  FxWirePro: EUR/AUD outlook weaker on renewed downside pressure
  FxWirePro- Woodies pivot (Major)
  Major Pair Action Bias: Bullish Pairs to Watch Out For
  JPY Action Bias: Bullish Pairs to Watch Out For
  FxWirePro: USD/CAD gaining momentum for a move towards 1.4200 level
  JPY Action Bias: USDJPY Emerges as the Clear Bullish Pair to Watch Amid Mixed Crosses
  FxWirePro- Major Crypto levels and bias summary
  FxWirePro- Major Pair levels and bias summary
  FxWirePro: USD/CAD positions for another climb, eyes 1.4150 level
  AUDJPY Weakness Deepens: Sell Rallies Toward 112 as Aussie Dollar Falters
  FxWirePro: EUR/NZD downside pressure builds, key support level in focus
  FxWirePro: GBP/AUD downside pressure builds, key support level in focus
  GBPJPY Slips After Sterling Weakness, Bears Eye 216


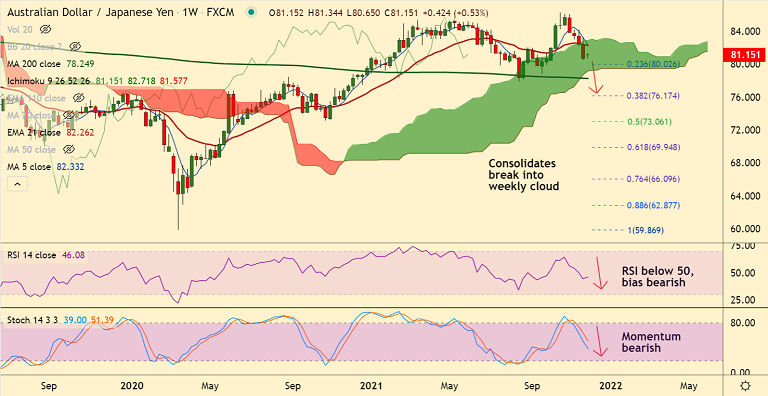
Chart - Courtesy Trading View
Technical Analysis: Bias Bearish
GMMA Indicator
- Major and minor trend are strongly bearish on daily and intraday charts
- Price action is below 200-DMA
Ichimoku Analysis
- Price action has slumped below daily cloud on Friday's trade
- The pair is consolidating previous week's break into weekly cloud
Oscillators
- Momentum strongly bearish, Stochs are RSI are sharply lower on weekly and daily charts
Bollinger Bands
- Bollinger bands are spread wide apart
- Volatility is high and rising
Major Support Levels: 79.72 (110-week EMA)
Major Resistance Levels: 82.89 (200-DMA)
Summary: AUD/JPY was trading with a bearish bias. The pair is consolidating previous session's whopping 2.61% slump. Further weakness on charts. Dip till 110-week EMA at 79.72 likely.


