
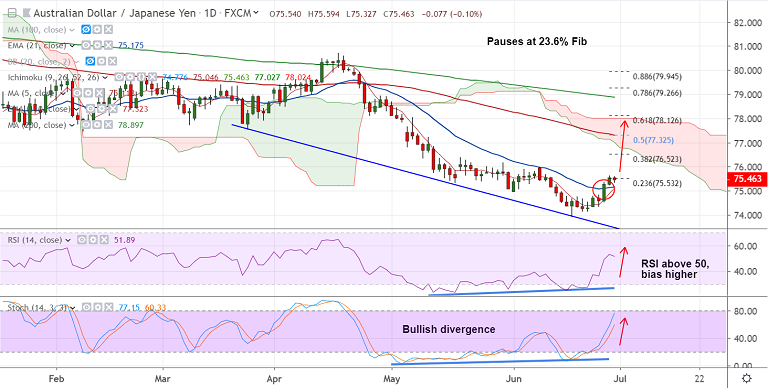
AUD/JPY chart - Trading View
AUD/JPY trades rangebound on the day, hovers around 23.6% Fib.
The pair is consolidating break above 4H 200-SMA before the next leg higher.
Technical indicators support further upside for the pair. MACD shows bullish crossover on signal line.
5-DMA has turned and Stochs and RSI are sharply higher. Price is holding break above 21-EMA.
Further, a 'Bullish Divergence' on RSI and Stochs on the daily charts adds to the upside bias.
Immediate resistance is seen at 55-EMA at 76.20. Break above finds next major resistance at cloud bottom at 77.02.
Failure to hold above 21-EMA to see weakness. Dip till 74.33 likely.
Support levels - 75.17 (21-EMA), 74.33 (June 24, 25 low)
Resistance levels - 76, 76.20 (55-EMA), 76.52 (38.2% Fib)
For details on FxWirePro's Currency Strength Index, visit http://www.fxwirepro.com/currencyindex.


