


 Gold Prices Fall Amid Rate Jitters; Copper Steady as China Stimulus Eyed
  Mexico's Undervalued Equity Market Offers Long-Term Investment Potential
  FxWirePro: USD/JPY edges higher as the yen remains vulnerable despite repeated warnings of intervention.
  FxWirePro: USD/ZAR remains buoyant, looks to extend gains
  FxWirePro: GBP/AUD steadies around 0.9145 ,retains bid tone
  European Stocks Rally on Chinese Growth and Mining Merger Speculation
  FxWirePro: GBP/USD slides toward critical support market reassesses UK political transition
  Moody's Upgrades Argentina's Credit Rating Amid Economic Reforms
  Sterling Slump Sends GBPJPY Toward 212.60 — Bearish EMA Stack Eyes 210
  FxWirePro- Major Crypto levels and bias summary
  FxWirePro: GBP/NZD gaining momentum for a move towards 2.3100 level
  2025 Market Outlook: Key January Events to Watch
  Geopolitical Shocks That Could Reshape Financial Markets in 2025
  Bitcoin Sheds $491M in ETF Outflows and Retreats Below $64K; Sellers Reload for $50K
  UBS Projects Mixed Market Outlook for 2025 Amid Trump Policy Uncertainty
  FxWirePro: USD/CNY hits one –month high, scope for further upside
  China's Refining Industry Faces Major Shakeup Amid Challenges


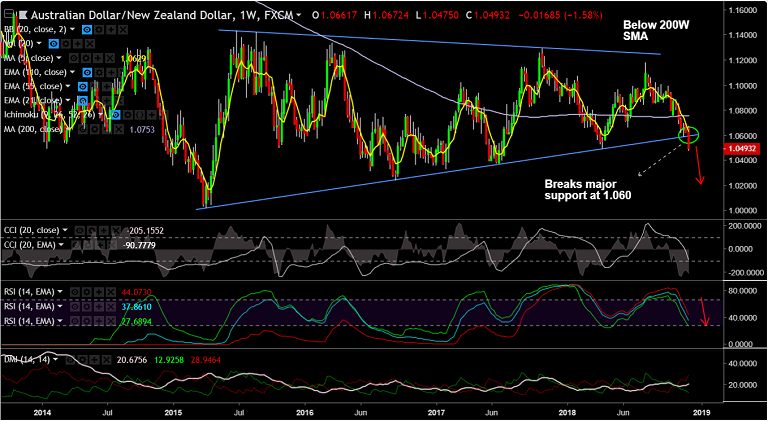
AUD/NZD chart on Trading View used for analysis
- AUD/NZD has broken "Symmetric Triangle" pattern, raising scope for further downside.
- The pair is extending weakness for the 6th straight session and hit 15-month lows at 1.0475.
- Breach at 'Triangle Base' support at 1.06 has opened up downside for the pair.
- Technicals support further weakness, drag till 1.0370 (Jun 2017 low) now likely.
- Technical indicators on weekly charts are also bearish. Stochs and RSI sharply lower.
- MACD supports downside. We see -ve DMI dominance and ADX rising in support of weakness.
- Price has slipped below weekly cloud and 200-W SMA and we see bearish invalidation only on retrace above.
Call update: Our previous call (https://www.econotimes.com/FxWirePro-AUD-NZD-Near-Term-Outlook-1467221) has hit targets.
Recommendation: Book partial profits, stay short for further downside. Target 1.0370.
For details on FxWirePro's Currency Strength Index, visit http://www.fxwirepro.com/currencyindex.


