


 FxWirePro: EUR/NZD downside pressure builds, key support level in focus
  FxWirePro: USD/CAD edges lower but bullish outlook persists
  FxWirePro: GBP/AUD bears maintain upper hand
  JPY Action Bias: USDJPY, EURJPY, and CADJPY Emerge as Top Extremely Bullish Picks
  BTC, ETH, SOL, XRP, and BNB: Major Crypto Pairs Stay Neutral
  FxWirePro- Major Crypto levels and bias summary
  FxWirePro: GBP/AUD under pressure as pound continues to weaken
  FxWirePro: EUR/NZD firms after ECB holds rates steady at 2.25%
  FxWirePro- Major Crypto levels and bias summary
  FxWirePro- Woodies pivot (Major)
  FxWirePro- Major Pair levels and bias summary
  FxWirePro: EUR/AUD neutral in the near term, scope for downward resumption
  FxWirePro: USD/ZAR retreats slightly but bias is bullish
  AUDJPY Extends Four-Day Rally on Yen Weakness: Bullish Dip-Buy Eyes 117-118
  FxWirePro: USD/CNY edges higher but bulls lack punch
  EUR/USD Slides After ECB Hold, Bearish Technicals Favor Rally Fades


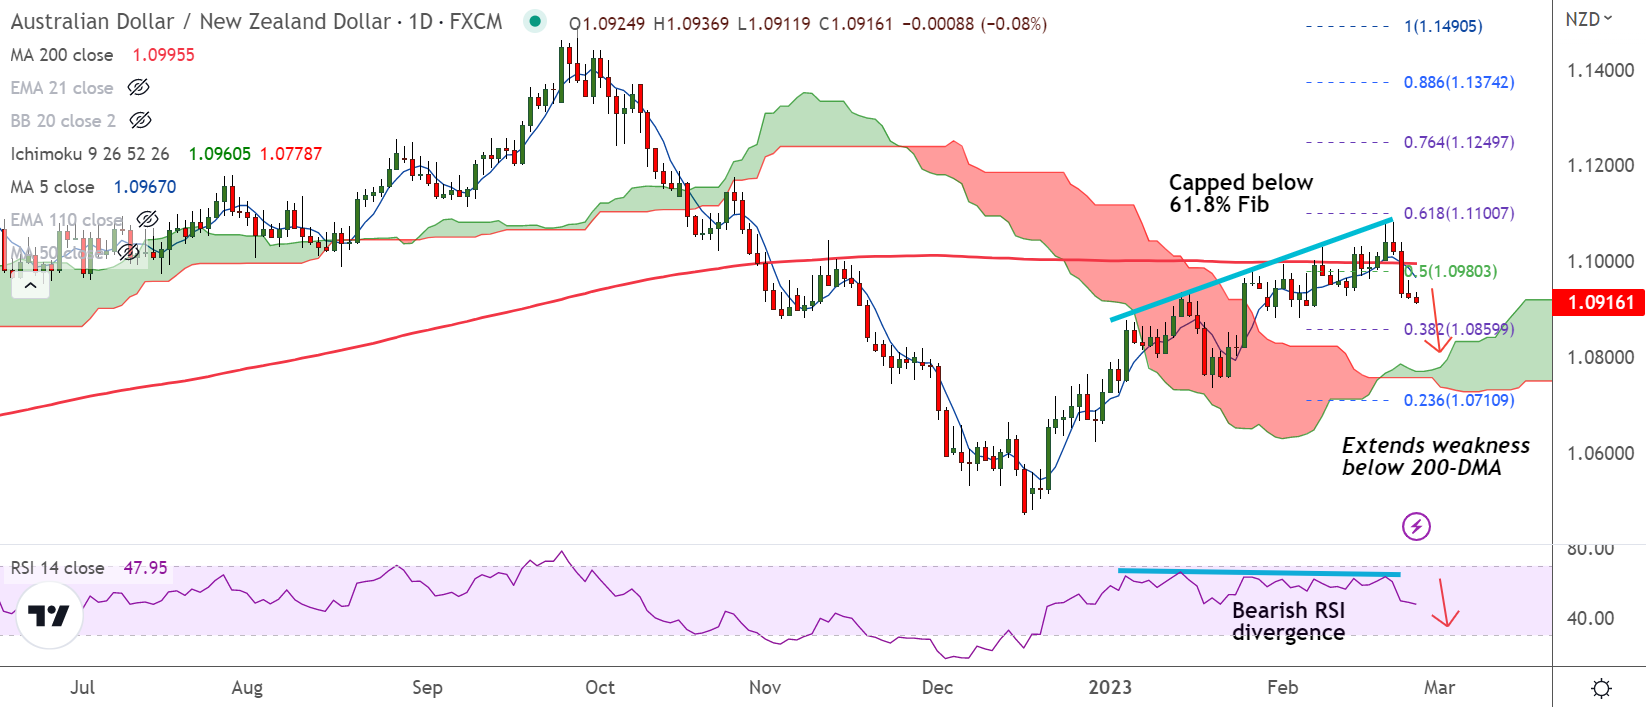
Chart - Courtesy Trading View
Technical Analysis:
- AUD/NZD was trading 0.12% lower on the day at 1.0911 at around 10:15 GMT
- The pair has failed to extend break above 200-DMA and has resumed weakness
- Bearish RSI divergence on the daily charts supports downside in the pair
- MACD and ADX support downside, Chikou span is biased lower
- GMMA indicator shows major and minor trend have turned bearish on the intraday charts
Support levels:
S1: 1.0907 (110-EMA)
S2: 1.0896 (55-EMA)
Resistance levels:
R1: 1.0945 (21-EMA)
R2: 1.0961 (20-DMA)
Summary: AUD/NZD trades with a bearish bias. Price action is currently holding minor support at 110-EMA, decisive break below will see more weakness. Dip till 38.2% Fib at 1.0860 likely.


