
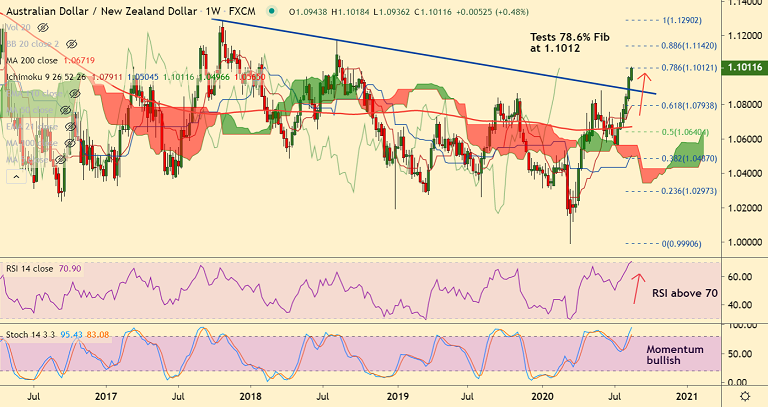
AUD/NZD chart - Trading View
AUD/NZD spikes over 0.50% on the day to hit highest since Sept 2018, outlook is bullish.
The pair is extending breakout at 200W SMA and technical analysis supports further upside.
Price action is above major moving averages on the daily and weekly charts. Momentum strongly bullish with Stochs and RSI sharply higher.
Analysis of GMMA shows major and minor trend on the daily and weekly charts are bullish. Volatility is rising as evidenced by widening Bollinger bands.
Price action has tested major resistance at 78.6% Fib at 1.1012, decisive break above will fuel further gains.
Oscillators are at highly overbought which keeps scope for pullback. However, pullbacks are likely to be shallow.
Next bull target lies at 88.6% Fib at 1.1142. Retrace below 200W MA to see weakness.


