
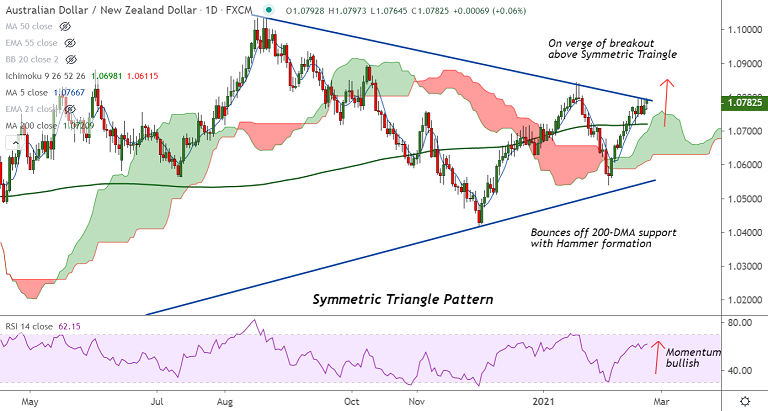
AUD/NZD chart - Trading View
Technical Analysis: Bias Bullish
- AUD/NZD edges higher from session lows at 1.0765, trades 0.06% higher at 1.0781 at 11:40 GMT
- Retrace in price has bounced of 200-DMA support and is on verge of breakout of Symmetric Triangle pattern
- Momentum studies are bullish, Stochs and RSI are sharply higher, RSI is above the 60 mark, supporting upside
- Volatility is high and rising as evidenced by widening Bollinger bands
- Dragonfly Doji on the previous week's candle suggests buying interest at lows
Support levels - 1.0766 (5-DMA), 1.0720 (200-DMA), 1.0694 (20-DMA)
Resistance levels - 1.08 (Trendline), 1.0820 (Upper BB), 1.0843 (Jan 19th high)
Summary: Global credit rating agency Fitch in its Long-Term Foreign-Currency Issuer Default Rating (IDR) analysis held Australia’s ‘AAA’ rating status intact with a negative outlook. Details of the report showed the rating statement cites the Aussie labor market on a stable path to recovery. Aussie is holding marginal gains across the board. AUD/NZD trades with a strong technical bias. The pair is on verge of breakout at Symmetric Triangle pattern. Scope for test of 1.0840.


