Technicals

Add as a preferred source on Google

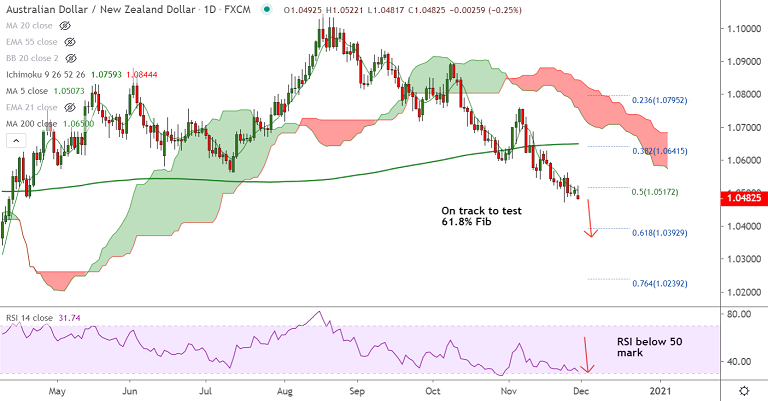
FxWirePro: AUD/NZD rejected at highs, pair set to extend weakness, 61.8% Fib at 1.0392 in sight

AUD/NZD chart - Trading View Technical Analysis: Bias Bearish - GMMA indicator shows major and minor trend are strongly bearish - Volatility is rising as evidenced by widening Bollinger bands - Recovery attempts capped a…

1 min read
FxWirePro: AUD/NZD rejected at highs, pair set to extend weakness, 61.8% Fib at 1.0392 in sight
Image from the original EconoTimes article

Read the original article

AUD/NZD chart - Trading View 

Technical Analysis: Bias Bearish

- GMMA indicator shows major and minor trend are strongly bearish

- Volatility is rising as evidenced by widening Bollinger bands

- Recovery attempts capped at 200H moving average, Price action has dipped into weekly cloud 

- Momentum indicators are strongly bearish, RSI well below 50 mark which supports weakness

Support levels - 1.0429 (Lower BB), 1.0392 (61.8% Fib), 1.0307 (Jan 27 low)

Resistance levels - 1.0506 (5-DMA), 1.0572 (21-EMA), 1.0650 (200-DMA)

Summary: AUD/NZD trades with a strong bearish bias. Upticks found selling pressure which was evident with long upper wicks in the daily candle. Scope for test of 61.8% Fib at 1.0392. Bearish invalidation only above 200-DMA. 

 

Related articles

View all
Technicals

Major Pair Currency Score: AUDUSD Bearish

EURUSD - Levels to watch - 1.100 GBPUSD Levels to watch - 1.3180 USDCHF Levels to watch - 0.8400 USDCAD - Levels to watch - 1.4300 AUDUSD - Levels to watch - 0.7000 NZDUSD - Levels to watch - 0.5560

