


 Major Pairs Action Bias: USDCAD and USDCHF Stand Out as Extremely Bullish While GBPUSD and NZDUSD Turn Extremely Bearish
  NZDJPY Action Bias: Bullish Dip-Buying Opportunity on Broad Yen Weakness
  FxWirePro: USD/ZAR retreats but trend is still bullish
  Crypto Action Bias: ETHUSD Stands Out as the Bullish Pair to Watch
  EUR/JPY Holds Bullish Bias as Euro Extends Recovery
  NZDJPY Pullback: Sell Rallies Toward 93.30 as Yen Weakness Eases
  FxWirePro: GBP/NZD gains some ground but bias is still bearish
  FxWirePro- Woodies pivot (Major)
  FxWirePro: NZD/USD edges lower, remains on back foot
  AUDJPY Weakness Deepens: Sell Rallies Toward 112 as Aussie Dollar Falters
  FxWirePro : USD/JPY holds relatively bid on 163 ahead Of FOMC,BoJ meetings
  GBPJPY Slips After Sterling Weakness, Bears Eye 216
  FxWirePro- Woodies pivot (Major)
  FxWirePro: USD/ZAR uptrend loses steam, remains on bullish path
  FxWirePro: EUR/NZD up trend gains momentum but hurdles ahead
  JPY Action Bias: USDJPY Emerges as the Clear Bullish Pair to Watch Amid Mixed Crosses
  FxWirePro: GBP/AUD downside pressure builds, key support level in focus


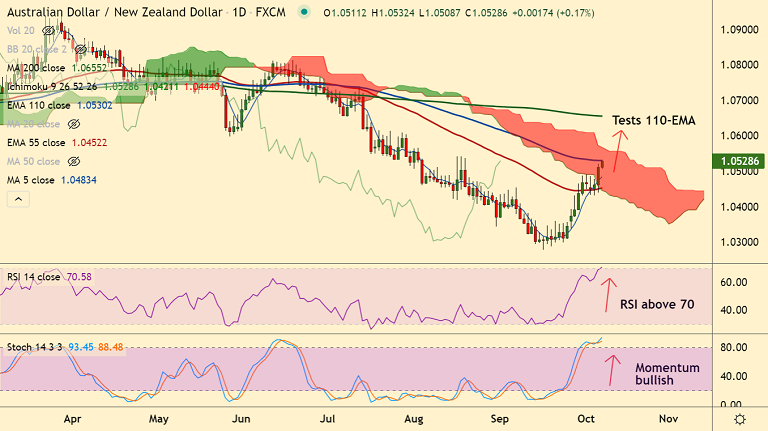
AUD/NZD chart - Trading View
Technical Analysis: Bias Bullish
- AUD/NZD was trading 0.17% higher on the day at 1.0528 at around 12:45 GMT
- The pair trades pivotal at 110-EMA resistance, break above will fuel further upside
- Momentum studies are bullish, but overbought conditions may cause some pullbacks
- MACD and ADX support further upside in the pair, volatility is also high
- GMMA indicator shows major and minor trend are bullish on the intraday charts
Support levels - 1.0483 (5-DMA), 1.0452 (55-EMA), 1.0418 (21-EMA)
Resistance levels - 1.0530 (110-EMA), 1.0567 (Cloud top), 1.0655 (200-DMA)
Summary: AUD/NZD trades with a bullish momentum. The pair finds immediate resistance at 110-EMA at 1.0530, decisive break above will propel the pair higher.


