


 FxWirePro- Major Crypto levels and bias summary
  FxWirePro: USD/ZAR firms ahead of Fed interest rate decision
  JPY Pairs Action Bias: EURJPY Leads as Bullish Standout Amid Mixed Momentum
  Buy the Dips on EUR/JPY: Bullish Structure Points to 188 Target Ahead of Fed
  FxWirePro: EUR/ AUD gains some ground , but remains on bearish path
  FxWirePro: USD/ CNY hits one-month low,scope for futher downside
  FxWirePro: USD/CAD runs out of steam but maintains bullish outlook
  FxWirePro: NZD/USD neutral in the near-term, scope for downward resumption
  FxWirePro: EUR/AUD regains upwards momentum but unable to hold above 50%fib level
  FxWirePro: USD/ CNY remains soft ahead of Fed decision
  FxWirePro:EUR/NZD gains some upside momentum but still bearish
  FxWirePro: USD/JPY edges higher as focus shifts to BOJ decision
  FxWirePro: AUD/USD falls after softer-than-expected Australian Q2 CPI
  FxWirePro: NZD/USD firms as Kiwi gains on strong ANZ business outlook data
  FxWirePro: GBP/AUD gains above 1.9200 level , upside pressure builds
  FxWirePro- Major Pair levels and bias summary


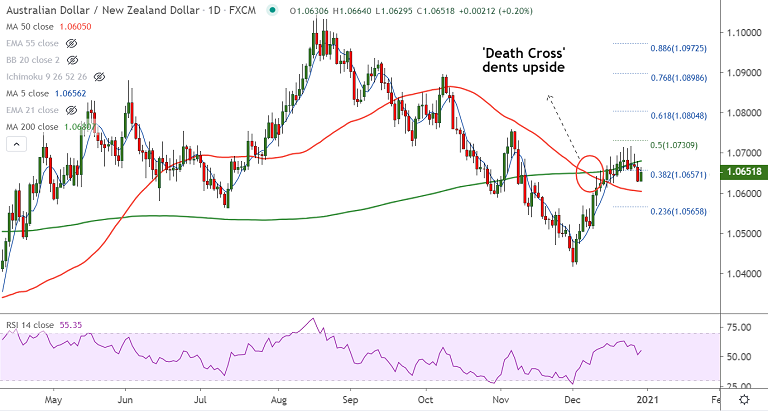
AUD/NZD chart - Trading View
Technical Analysis: Bias Bearish
- AUD/NZD slips lower from session highs, upside capped at 110-EMA
- Stochs show rollover from overbought levels and RSI is also biased lower
- Long upper wicks on the daily candles shows bulls are struggling to take prices higher
- 'Death Cross' (bearish 50-DMA crossover on 200-DMA) adds to bearish pressure on the pair
- 21-EMA is strong support at 1.0627, break below will see more weakness
Support levels - 1.0627 (21-EMA), 1.0616 (20-DMA), 1.0605 (50-DMA)
Resistance levels - 1.0680 (200-DMA), 1.07 (Psychological mark), 1.0730 (50% Fib)
Summary: AUD/NZD was trading 0.21% higher at 1.0653 at around 10:35 GMT, but upside lacks traction. Outlook is turning bearish and the pair is showing signs of weakness after failing to break above 200-DMA. 21-EMA is offering strong support at 1.0627, break below will see weakness.


