


 FxWirePro: USD/CAD gaining momentum for a move towards 1.4200 level
  FxWirePro: EUR/NZD up trend gains momentum but hurdles ahead
  JPY Action Bias: Bullish Pairs to Watch Out For
  FxWirePro: AUD/USD gains on Iran-US truce hopes, risk rally
  AUDJPY Weakness Deepens: Sell Rallies Toward 112 as Aussie Dollar Falters
  AUDJPY Action Bias: Bullish Dip-Buy Setup Despite Flat Neutral Bias
  FxWirePro- Major Crypto levels and bias summary
  FxWirePro: USD/CAD positions for another climb, eyes 1.4150 level
  FxWirePro: USD/ZAR uptrend loses steam, remains on bullish path
  FxWirePro: EUR/AUD outlook weaker on renewed downside pressure
  FxWirePro: GBP/AUD under pressure as pound continues to weaken
  FxWirePro: USD/CNY dips as yuan firms on improving risk appetite
  FxWirePro :USD/JPY eases slightly, remains on bullish path
  GBPJPY Slips After Sterling Weakness, Bears Eye 216
  FxWirePro: GBP/NZD downside pressure builds, key support levels in focus
  Major Pair Action Bias: Bullish Pairs to Watch Out For
  NZDJPY Pullback: Sell Rallies Toward 93.30 as Yen Weakness Eases


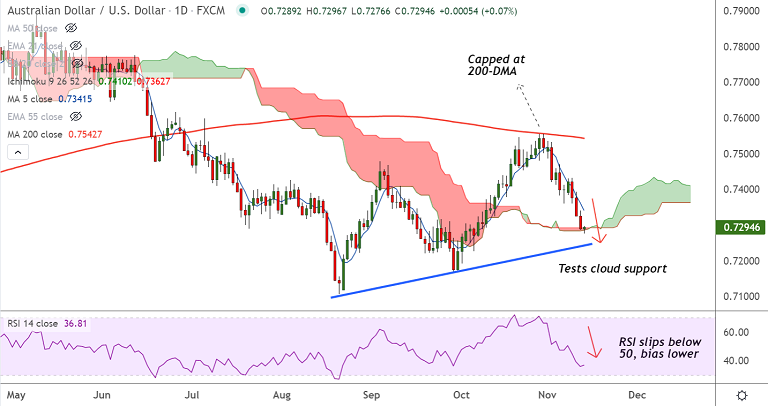
Chart - Courtesy Trading View
Technical Analysis: Bias Bearish
GMMA Indicator
- Near-term moving averages are bearish, long-term moving averages are turning bearish
Ichimoku Analysis
- Price action is holding support at daily cloud
- Chikou span is biased lower
Oscillators
- Stochs are RSI are biased lower, momentum is bearish
- RSI is below 50 mark, while Stochs are in oversold territory
Bollinger Bands
- Bollinger Bands are spread wide apart, indicating high volatility
Fundamental Overview:
AUD/USD is likely to be dragged lower by U.S. dollar strength. Dollar was set for its best week in five months.
U.S. inflation data released on Wednesday showed that the US CPI grew 6.2% y/y and 0.9% m/m in October, while the core CPI rose 4.6% y/y and 0.6% m/m.
Investors are now pricing the first rate hike by July 2022 and another by December of that year, according to Reuters data.
Focus now on inflation readings from a University of Michigan survey, along with JOLTS job openings data later in the day for further impetus.
New York Fed President John Williams is scheduled to speak at an online conference, which could provide clues to the Fed’s reaction to high inflation.
Major Support Levels: 0.7285 (cloud base), 0.7245 (Rising trendline)
Major Resistance Levels: 0.7341 (5-DMA), 0.7394 (200H MA)
Summary: AUD/USD pivotal at cloud support. Decisive break below will drag the pair lower. Scope for test of 0.7245.


