


 AUDJPY Action Bias: Bullish Dip-Buy Setup Despite Flat Neutral Bias
  FxWirePro: GBP/AUD downside pressure builds, key support level in focus
  FxWirePro: NZD/USD edges lower, remains on back foot
  FxWirePro: USD/ZAR uptrend loses steam, remains on bullish path
  FxWirePro: USD/CAD runs out of steam but maintains bullish outlook
  FxWirePro- Major Pair levels and bias summary
  FxWirePro: AUD/USD dips after RBA Governor speech
  FxWirePro: GBP/NZD gains some ground but bias is still bearish
  FxWirePro- Major Pair levels and bias summary
  FxWirePro: EUR/AUD outlook weaker on renewed downside pressure
  GBPJPY Slips After Sterling Weakness, Bears Eye 216
  Major Pairs Action Bias: USDCAD and USDCHF Stand Out as Extremely Bullish While GBPUSD and NZDUSD Turn Extremely Bearish
  FxWirePro: USD/CAD gaining momentum for a move towards 1.4200 level
  AUDJPY Weakness Deepens: Sell Rallies Toward 112 as Aussie Dollar Falters
  FxWirePro- Woodies pivot (Major)
  FxWirePro: EUR/NZD up trend gains momentum but hurdles ahead
  EUR/USD Bounces from Monthly Low, But Bearish Pressure Remains


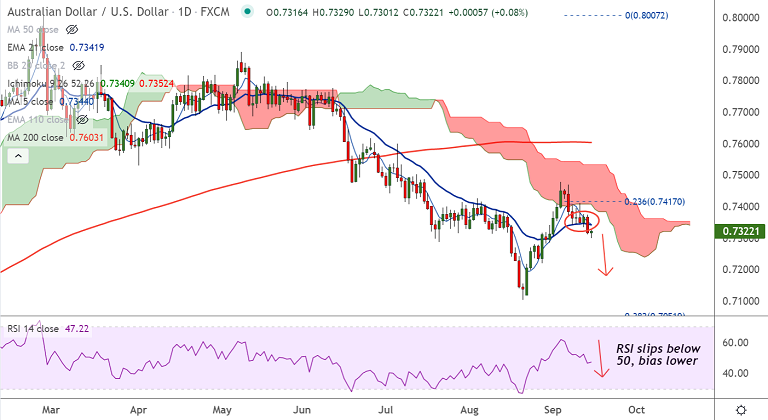
AUD/USD chart - Trading View
Technical Analysis: Bias Bearish
GMMA Indicator
- Major and minor trend are bearish
Ichimoku Analysis
- Cloud caps upside on the daily charts
- Chikou span is flat, with bearish bias
Oscillators
- Stochs and RSI are biased lower and are in neutral territory
Bollinger Bands
- Bollinger bands are spread wide apart suggesting high volatility
Major Support Levels: 0.7309 (110-week EMA), 0.7216 (200-week EMA)
Major Resistance Levels: 0.7344 (5-DMA), 0.7388 (55-EMA)
Summary: AUD/USD is consolidating break below 21-EMA. US dollar weakness is limiting downside in the pair. Focus on FOMC meet for imptus.


