
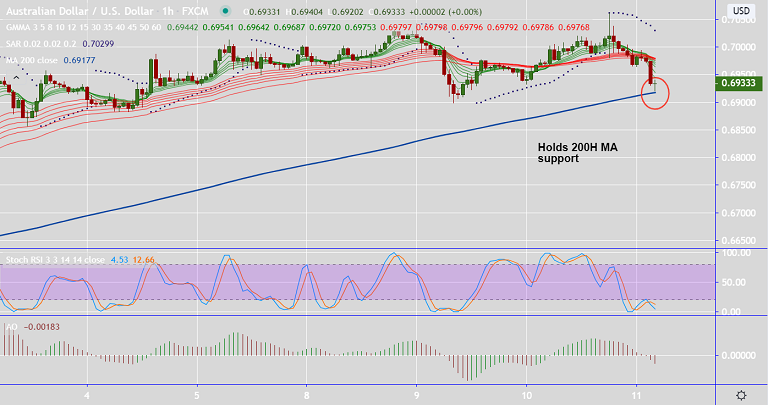
AUD/USD chart - Trading View
Technical Analysis: Bias Bearish
GMMA Indicator
- Daily chart: Major trend is bullish, minor trend is neutral
- Hourly chart: Major trend is neutral, minor trend is bearish
Ichimoku Analysis
- Price action is above cloud on the daily chart, but, Chikou Span has turned bearish
- On the hourly charts, the pair has slipped below cloud and bearish Tenkan Sen crossover on Kijun Sen adds to the downside bias.
Oscillators
- Stochs and RSI are at overbought levels, on verge of rollback into neutral
Bollinger Bands
- Volatility is high on the daily charts
- Bollinger bands are widening on the hourly charts, suggesting rising volatility
Summary: The pair has slipped below 5-DMA and technical indicators are turning bearish on the intraday charts. Price action is holding support at 200H SMA at 0.6918, break below will see major weakness.
Major Support Levels: 0.6918 (200H MA), 0.6856 (Tenkan Sen), 0.6663 (200-DMA)
Major Resistance Levels: 0.6973 (5-DMA), 0.7064 (June 10 high), 0.7121 (Upper BB)


