


 FxWirePro- Major Pair levels and bias summary
  Gold Prices Slide as Rate Cut Prospects Diminish; Copper Gains on China Stimulus Hopes
  FxWirePro- Woodies pivot (Major)
  Bank of America Posts Strong Q4 2024 Results, Shares Rise
  US Gas Market Poised for Supercycle: Bernstein Analysts
  Urban studies: Doing research when every city is different
  FxWirePro: EUR/AUD bullish outlook with scope to target 1.6550
  FxWirePro: GBP/USD heads deeper into bear territory, 23.6% fibonacci eyed
  FxWirePro: NZD/USD downside pressure builds, key support level in focus
  Sterling Slump Sends GBPJPY Toward 212.60 — Bearish EMA Stack Eyes 210
  Mexico's Undervalued Equity Market Offers Long-Term Investment Potential
  Gold Prices Fall Amid Rate Jitters; Copper Steady as China Stimulus Eyed
  UBS Projects Mixed Market Outlook for 2025 Amid Trump Policy Uncertainty
  Lithium Market Poised for Recovery Amid Supply Cuts and Rising Demand
  FxWirePro: GBP/NZD gaining momentum for a move towards 2.3350level
  China’s Growth Faces Structural Challenges Amid Doubts Over Data


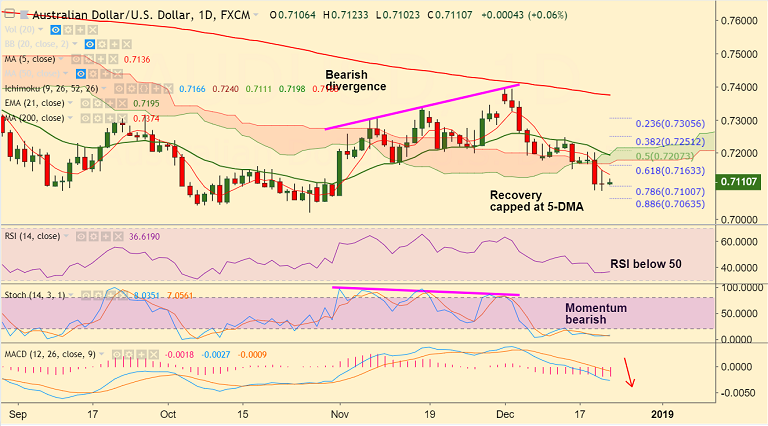
AUD/USD chart on Trading View used for analysis
- AUD/USD recovery attempts were capped below 5-DMA at 0.7148 on Thursday's trade.
- The major has formed a Doji candle on Thursday and is currently trading at 0.7110, up 0.05% at the time of writing.
- Technical indicators support downside and we do not see any major signs of reversal.
- Price action hovers around 78.6% Fib and further weakness to see dip till 0.7021 (Oct 26 low).
- Momentum indicators are at oversold levels and we could see some consolidation before the next leg lower.
- Long-term trend remains bearish and recovery was capped at 200-DMA after which the pair has resumed weakness.
- Any bearish invalidation only above 200-DMA. Downside scope till 0.6827 (Jan 2016 low).
Support levels - 0.71, 0.7063 (88.6% Fib)
Resistance levels - 0.7136 (5-DMA), 0.7163 (61.8% Fib)
For details on FxWirePro's Currency Strength Index, visit http://www.fxwirepro.com/currencyindex.


