
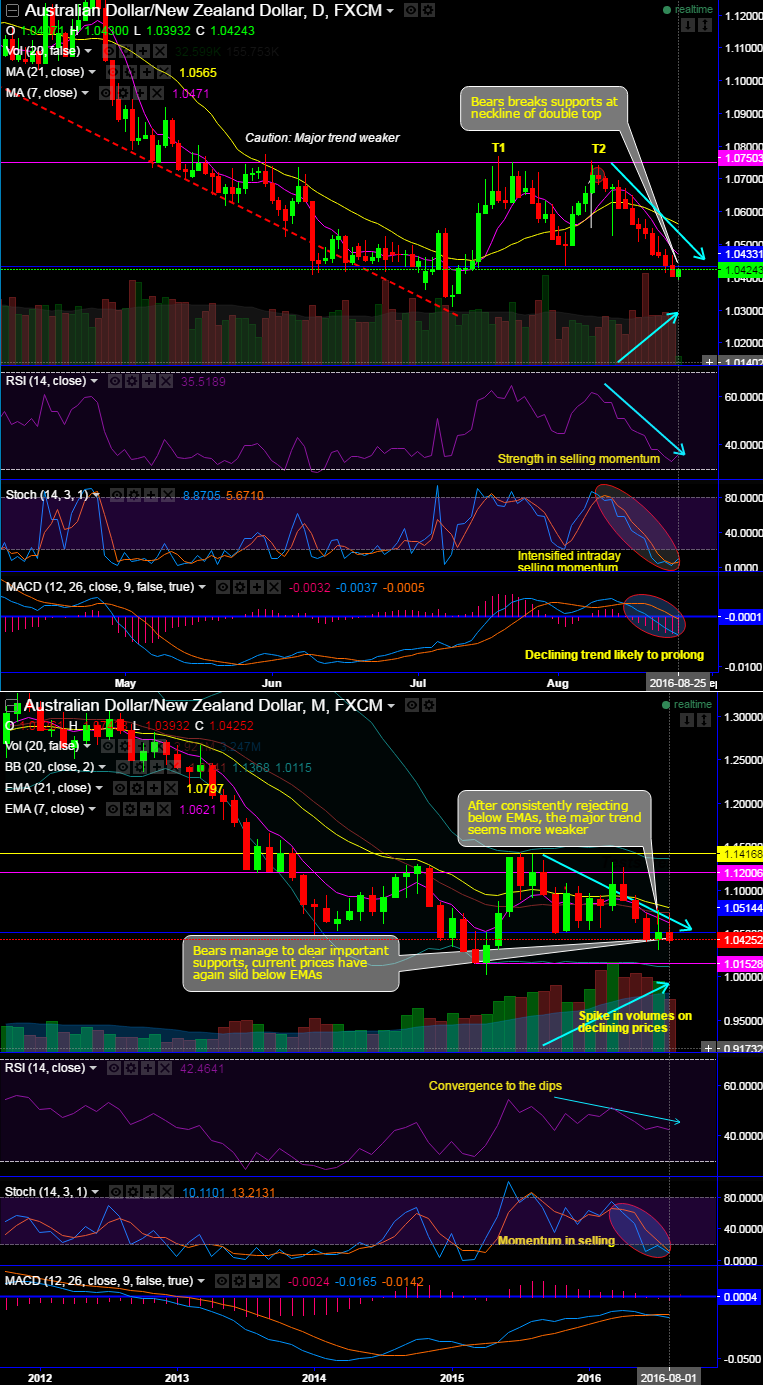
AUDNZD forms the double top pattern on the daily chart with top 1 at 1.0771 and top 2 at 1.0743 levels.
Bears managed to break supports at the neckline of the double top (at 1.0433 on daily charts).
After consistently rejecting below EMAs, the major trend seems very weaker.
Bears manage to clear important supports; the current prices have again slid below EMAs on the monthly chart.
Most notably, please observe massive volumes creation on every price decline both on daily as well as monthly graphs.
The selling momentum is confirmed by both leading indicators (RSI and Stochastic converge downwards to the prevailing price dips).
21DMA and 21EMA have crossed above 7DMA and 7EMA respectively (on daily and monthly graphs), while MACD has shown a bearish convergence below zero levels which would mean that the declining trend to prevail further.
Trade tips:
Intraday speculators can buy boundary option with upper strikes at 1.0443 and lower strikes at 1.0407 levels, alternatively, on a delivery basis, one also stay short in near month futures as well for southward targets of 1.0310 levels.


