


 GBPJPY Bullish Surge: Strong Pound Ignites Fresh Upside on Fed-BOE Policy Divergence as All EMAs Align
  JPY Action Bias: CADJPY Turns Extremely Bullish While Other Pairs Hold Positive Ground
  Gold Loses Steam After Strong U.S. Retail Sales
  FxWirePro:EUR/NZD stuck In narrow ranges, focus on near term support
  JPY Action Bias: Extremely Bullish Surge Ignites Across NZD, GBP & AUD
  FxWirePro: USD/ZAR advances as South African rand weakens amid renewed Middle East tensions
  FxWirePro- Major Pair levels and bias summary
  FxWirePro: EUR/AUD outlook weaker on renewed downside pressure
  Crypto Major Pair Action Bias: ETHUSD Bullish as BTCUSD, SOLUSD & XRPUSD Stay Neutral


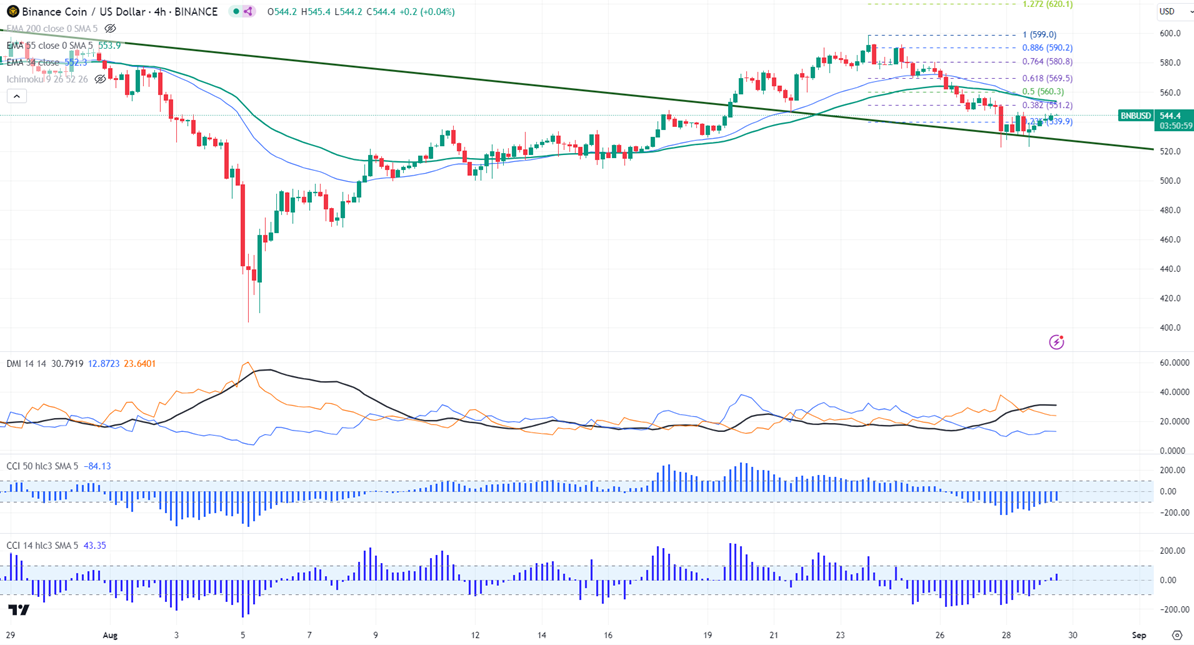
Horizontal trend line- $605
BNBUSD consolidating after a minor sell-off.
Any daily close above $605 confirms further bullishness.
BNBUSD formed a double bottom around $520.The pair holds below the short-term (34 and 55 EMA) and long-term moving average in the 4-hour. It hit a high of $545.80 at the time of writing and is currently trading around $545.
The bullish invalidation can happen if the pair closes below $400. On the lower side, the near-term support is $519.80 (200-day EMA). Any break below targets $500/$460.
The immediate resistance stands at around $553. Any breach above confirms minor bullishness. A jump to $560/$569/$580/$600 is possible. A surge past $605 will take it to $700.
Indicators ( 4- hour chart)
Directional movement index -Bearish
CCI (50)- Bearish
CCI(14)- Bullish
It is good to buy on dips around $520 with SL around $470 for TP of $605.


