


 FxWirePro:EUR/NZD dips below lower range, bearish bias increases
  ETH Stands Alone Bullish; BTC, SOL, XRP, BNB Neutral
  FxWirePro: USD/JPY holds steady near 162 as traders await fresh catalysts
  JPY Action Bias: CADJPY Turns Extremely Bullish While Other Pairs Hold Positive Ground
  FxWirePro: GBP/NZD downtrend loses steam, remains on bearish path
  FxWirePro- Major Pair levels and bias summary
  FxWirePro- Major Crypto levels and bias summary
  JPY Action Bias: Extremely Bullish Surge Ignites Across NZD, GBP & AUD
  FxWirePro- Major Crypto levels and bias summary
  Gold Loses Steam After Strong U.S. Retail Sales
  FxWirePro: GBP/NZD gains some upside momentum but still bearish
  Major Pair Action Bias: Extremely Bullish Surge Powers GBPUSD & NZDUSD as Bullish Momentum Ignites
  FxWirePro: NZD/USD trades in narrow range ,outlook bullish


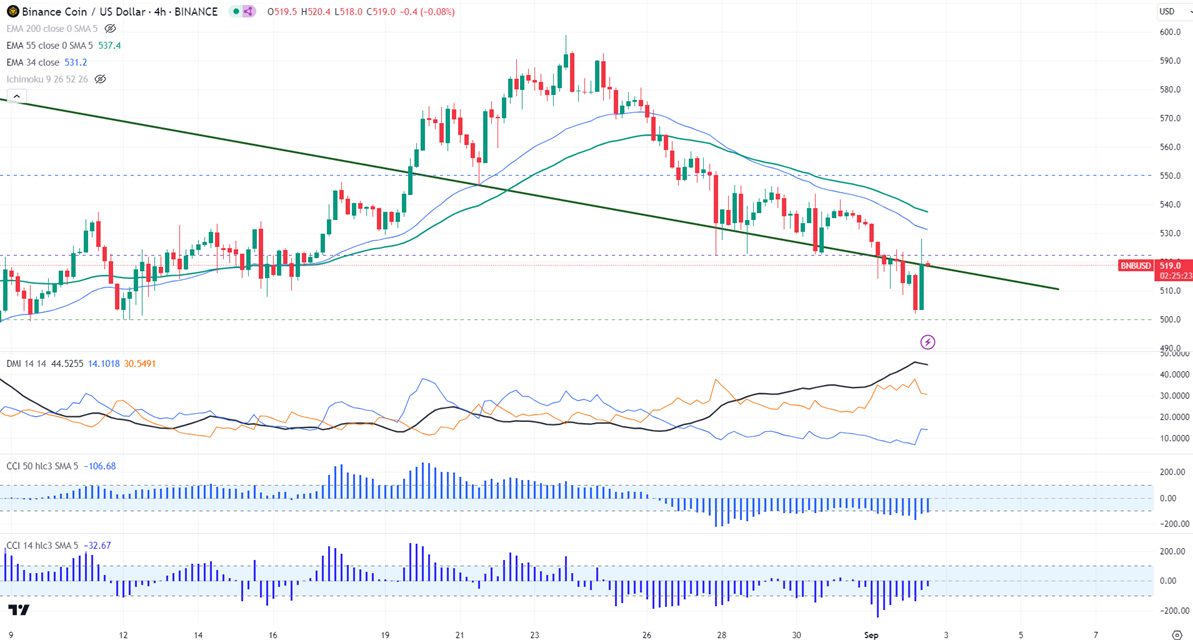
Horizontal trend line- $605
BNBUSD trades weak with intraday bias bearish.
Any daily close above $605 confirms further bullishness.
BNBUSD gained slightly after breaking 200-day EMA. The pair holds below the short-term (34 and 55 EMA) and long-term moving average in the 4-hour. It hit a low of $503 and is currently trading around $519.40.
The bullish invalidation can happen if the pair closes below $403 (Aug 5th low). On the lower side, the near-term support is $519.80 (200-day EMA). Any close below confirms a bearish continuation . A dip to $500/$460/$449 is possible.
The immediate resistance stands at around $553. Any breach above confirms minor bullishness. A jump to $569/$580/$600 is possible. A surge past $605 will take it to $700.
Indicators ( 4- hour chart)
Directional movement index -Bearish
CCI (50)- Bearish
CCI(14)- Bearish
It is good to buy on dips around $500 with SL around $449 for TP of $605.


