


 AUDJPY Bullish Surge: Strong Australian Dollar Fuels Fresh Upside as Pair Holds Above 113.50 and All EMAs Align
  Major Pair Action Bias: Extremely Bullish Surge Powers GBPUSD & NZDUSD as Bullish Momentum Ignites
  ETH Stands Alone Bullish; BTC, SOL, XRP, BNB Neutral
  FxWirePro: GBP/NZD gains some upside momentum but still bearish
  FxWirePro: USD/CAD falls after BoC rate hold and weak U.S. producer inflation
  FxWirePro- Major Crypto levels and bias summary
  FxWirePro:EUR/NZD stuck In narrow ranges, focus on near term support
  Gold Loses Steam After Strong U.S. Retail Sales
  FxWirePro: GBP/USD under pressure despite UK's modest economic growth


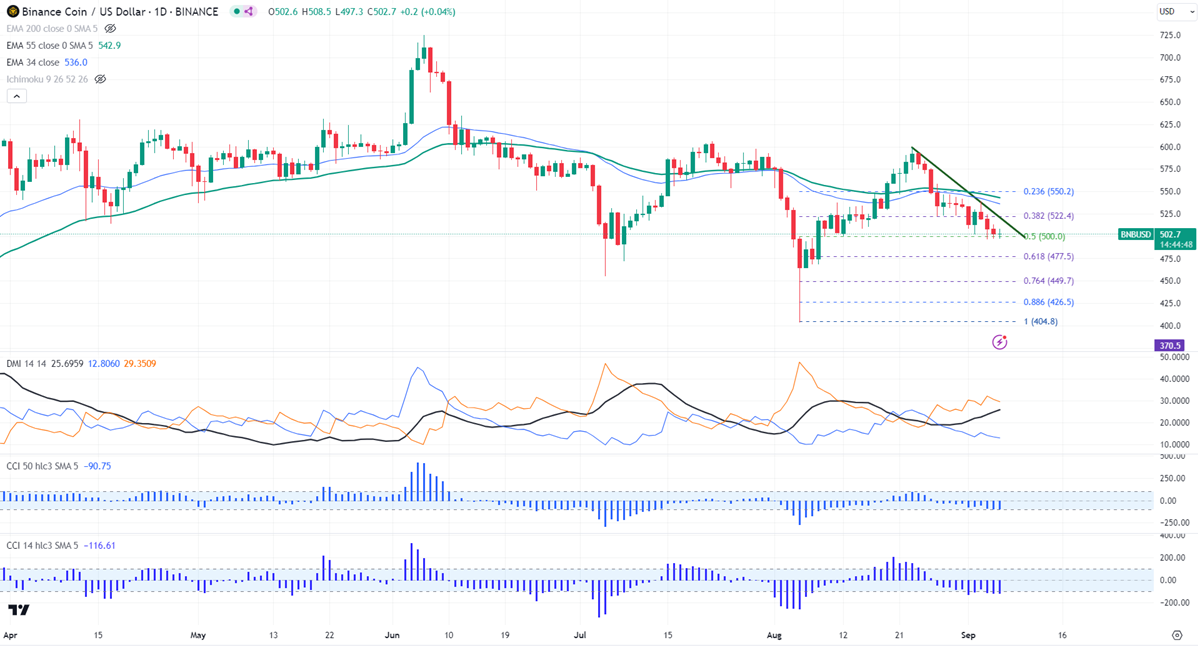
Intraday bias - nEUTRAL
Horizontal trend line- $605
Any close above $555 confirms intraday bullishness.
BNBUSD trades in a narrow range between $496 and $513 for the past three days. The pair was one of the worst performers in the past two weeks and lost nearly $80. It hit a low of $497 at the time of writing and is currently trading around $502.60.
The intraday bearish trend continuation can happen if the pair breaks $490. On the lower side, the near-term support is $490. Any break below targets $477/$450/$403 is possible.
The immediate resistance stands at around $520.10 (200-day EMA). Any breach above confirms minor bullishness. A jump to $541/$553 is possible. Bullish continuation only if it breaks $553. A surge past $553 will take it to $605/$700.
Indicators ( Daily chart)
Directional movement index -Bearish
CCI (50)- Bearish
CCI(14)- Bearish
It is good to buy above $553 with SL around $519 for TP of $700.


