


 FxWirePro: AUD/ USD eases as risk sentiment remains fragile
  ETH Stands Alone Bullish; BTC, SOL, XRP, BNB Neutral
  FxWirePro: GBP/USD under pressure despite UK's modest economic growth
  JPY Action Bias: Extremely Bullish Surge Ignites Across NZD, GBP & AUD
  FxWirePro: EUR/AUD neutral in the near term, scope for downward resumption
  Crypto Major Pair Action Bias: ETHUSD Bullish as BTCUSD, SOLUSD & XRPUSD Stay Neutral
  NZDJPY Bullish Surge: Strong Kiwi Ignites Fresh Upside as 94 Support Holds and All EMAs Align
  FxWirePro: USD/CAD falls after BoC rate hold and weak U.S. producer inflation
  FxWirePro- Major Crypto levels and bias summary
  FxWirePro: EUR/AUD outlook weaker on renewed downside pressure
  Gold Loses Steam After Strong U.S. Retail Sales
  FxWirePro: NZD/USD trades in narrow range ,outlook bullish
  FxWirePro: USD/JPY uptrend loses steam, remains on bullish path


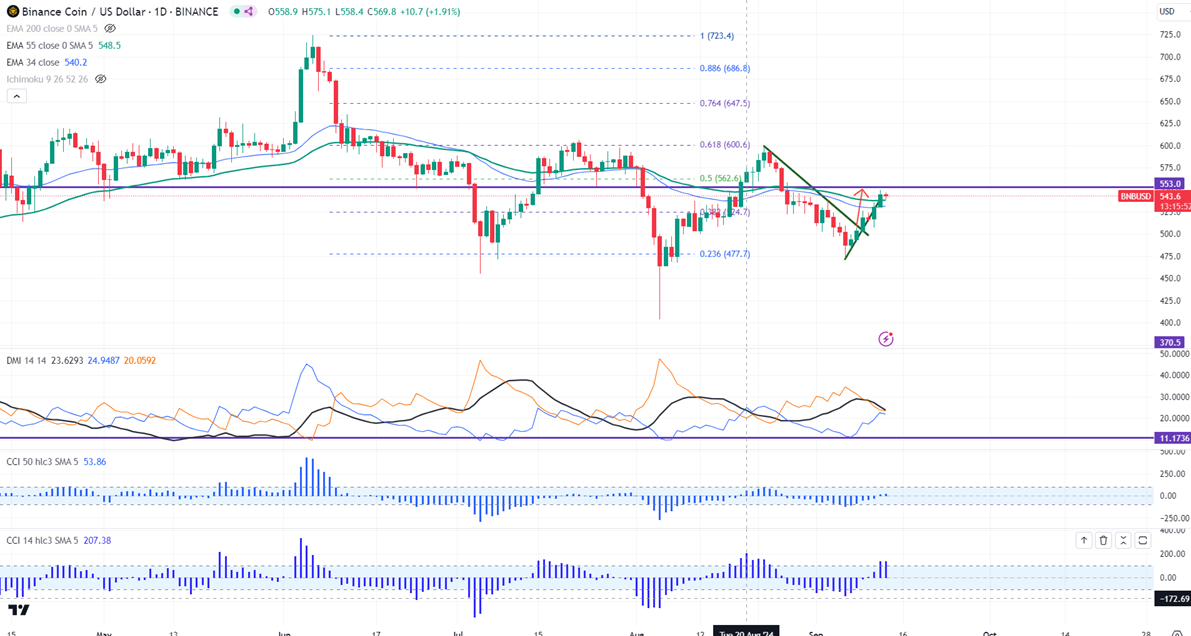
Intraday bias - Bullish
Horizontal trend line- $605
Any close above $562 confirms intraday bullishness.
BNBUSD traded higher for the fifth consecutive days and jumped more than $70.It hit a high of $549.50 and is currently trading around $542.80.
The pair holds above 34 and 55 EMA in the daily chart. The intraday bearish trend continuation can happen if the pair breaks $490. On the lower side, the near-term support is $490. Any break below targets $470/$456 (127.2% fib)/$437 (1.618% fib)/$403 is possible.
The immediate resistance stands at around $562.50 (50% fib). Any breach above confirms minor bullishness. A jump to $569/$605 is possible. Bullish continuation only if it breaks $605. A surge past $605 will take it to $700.
Indicators ( Daily chart)
Directional movement index - Bullish
CCI (50)- Bullish
CCI(14)- Bullish
It is good to buy on dips around $540 with SL around $518 for TP of $605/$700.


