


 Major Pair Action Bias: USDCHF Turns Bullish as EURUSD Stays Bearish – Key Pairs to Watch
  FxWirePro: AUD/USD bulls struggles as upside momentum fades
  FxWirePro: EUR/ AUD downtrend loses steam, remains on bearish path
  FxWirePro:USD/JPY hovers near 40-year peak,intervention fears linger
  FxWirePro: USD/CNY gains some upside momentum but bias still bearish
  FxWirePro: USD/CAD retreats slightly but trend is still bullish
  FxWirePro: AUD/USD rallies on jobs surge, heads to test key resistance
  FxWirePro: GBP/AUD downtrend loses steam but outlook still bearish
  FxWirePro: USD/ZAR slips as rand gains on U.S.-Iran developments
  JPY Action Bias: USDJPY, AUDJPY & EURJPY Turn Extremely Bullish – Top Pairs to Watch
  FxWirePro: GBP/NZD downtrend loses steam, remains on bearish path
  FxWirePro- Major Crypto levels and bias summary
  FxWirePro: EUR/ AUD dips below 1.6300 level, focus on near term support
  GBPJPY Weakens on Soft UK CPI: Sell Below 217.80 Targeting 216.40
  FxWirePro: GBP/USD stays below 1.3400 level following cooler inflation report
  FxWirePro: GBP/AUD dips amid heightened Geopolitical concerns


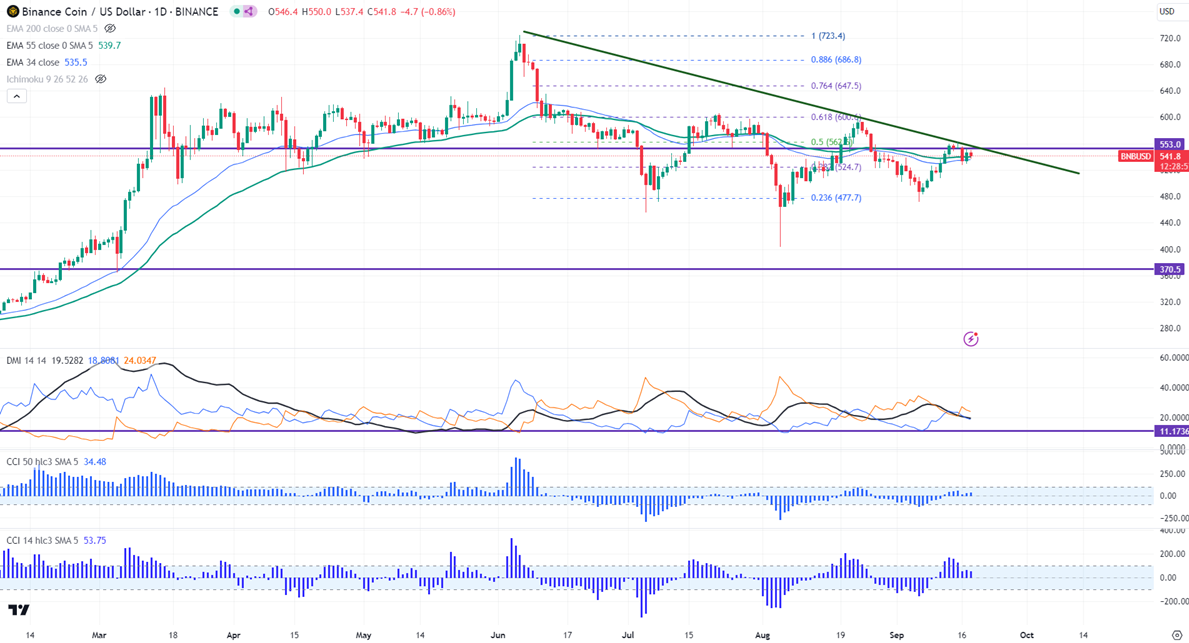
Intraday bias - Bullish
Horizontal trend line- $605
Any close above $562 confirms intraday bullishness.
BNBUSD trades flat after a minor pullback. It hit a high of $553 and is currently trading around $542.50.
The pair holds above 34 and 55 EMA in the 4-hour chart. The intraday bearish trend continuation can happen if the pair closes below $520. On the lower side, the near-term support is $527 (38.2% fib). Any break below targets $520 (200- day EMA) $490/$470/$456 (127.2% fib)/$437 (1.618% fib)/$403 is possible.
The immediate resistance stands at around $553. Any breach above confirms minor bullishness. A jump to $562.50 (50% fib)/$569/$605 is possible. Bullish continuation only if it breaks $605. A surge past $605 will take it to $700.
Indicators ( Daily chart)
Directional movement index - Neutral
CCI (50)- Bullish
CCI(14)- Bullish
It is good to buy on dips around $540 with SL around $518 for TP of $605/$700.


