


 FxWirePro- Major Crypto levels and bias summary
  FxWirePro- Major Crypto levels and bias summary
  Major Pair Action Bias: Extremely Bullish Surge Powers GBPUSD & NZDUSD as Bullish Momentum Ignites
  FxWirePro- Major Crypto levels and bias summary
  GBPJPY Bullish Surge: Strong Pound Ignites Fresh Upside on Fed-BOE Policy Divergence as All EMAs Align
  FxWirePro- Major Crypto levels and bias summary


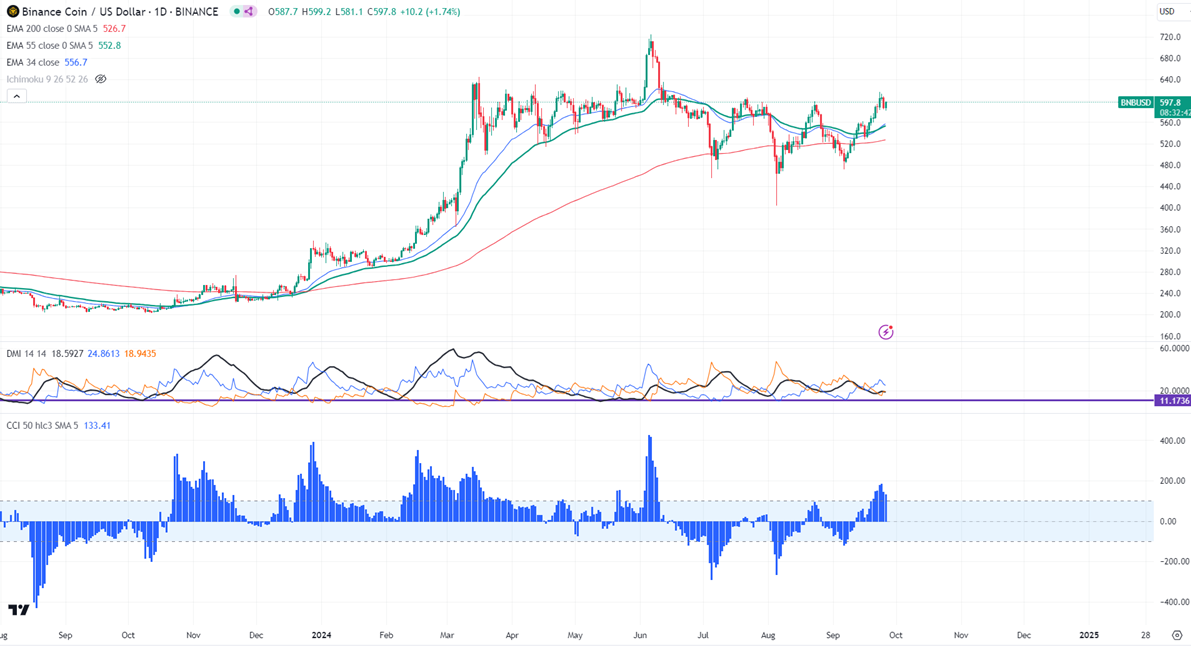
Intraday bias - Bullish
Re-test level- $562
Any close above $615 confirms a bullish continuation.
BNBUSD took support near 200- H EMA and showed a minor pullback. It hit a high of $599 at the time of writing and is currently trading around $598.60.
The pair holds above 34 and 55 EMA in the 4-hour chart. The bullish trend continuation can happen if the pair closes above $600 in the weekly chart. On the lower side, the near-term support is $580. Any break below targets $562/$554/$540 is possible.
The immediate resistance stands at around $615. Any breach above confirms minor bullishness. A jump to $647/$700 is possible. A surge past $725 will take it to $800.
Indicators ( 4- hour chart)
Directional movement index - Bullish
CCI (50)- Bullish
It is good to buy on dips around $580 with SL around $554 for TP of $700.


