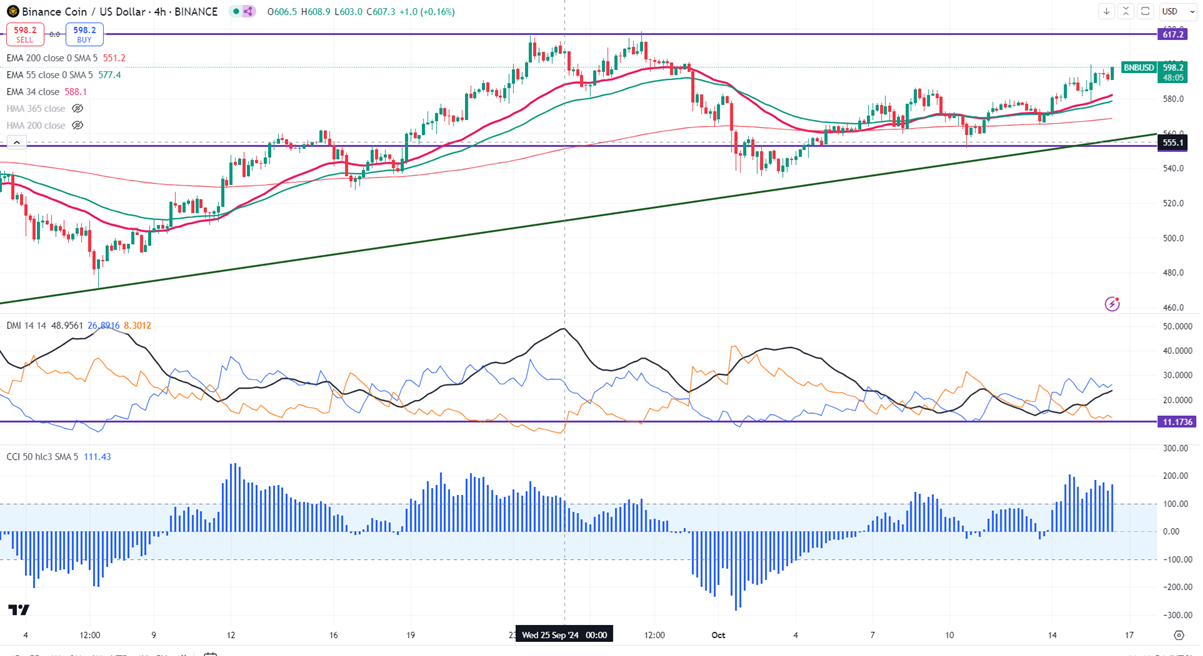
Intraday Outlook - Bullish
Key Level to Watch: $550
A close above $620 would confirm a continuation of the bullish trend.
BNB/USD has been trading within a narrow range of $618 to $534 for the past three weeks. At the time of writing, it has reached a high of $599.60 and is currently priced around $595.40.
The pair remains above the 34 and 55 EMA on the 4-hour chart. A bearish trend could emerge if it falls below $551. Conversely, a sustained bullish trend will require the pair to close above $618 on the daily chart. On the downside, near-term support is found at $570, with potential targets of $550, $540, $528, $500, and $470 if a break occurs.
Immediate resistance is at approximately $605, and a breakout above this level would indicate minor bullish momentum. A rise to $620, $647, or even $700 is feasible. Surging past $725 could propel prices to $800.
Indicators (4-hour chart)
- Directional Movement Index: Neutral
- CCI (50): Bullish
It is advisable to buy on dips near $560 with a stop-loss at $528 and a target price of $700.