


 FxWirePro: NZD/USD advances as hawkish outlook by a top policy maker boosts kiwi dollar
  FxWirePro: USD/CNY edges lower , bearish outlook persists
  FxWirePro- Major Crypto levels and bias summary
  FxWirePro: GBP/USD weighed down by renewed Middle East attacks
  NZDJPY Smashes 4-Month High on Kiwi Buying Frenzy – Bullish Setup Remains Strong
  FxWirePro- Major Crypto levels and bias summary
  FxWirePro- Major Crypto levels and bias summary
  FxWirePro- Woodies pivot (Major)
  USD/CHF Surges on Broad Dollar Buying, Eyes 0.8200 Next


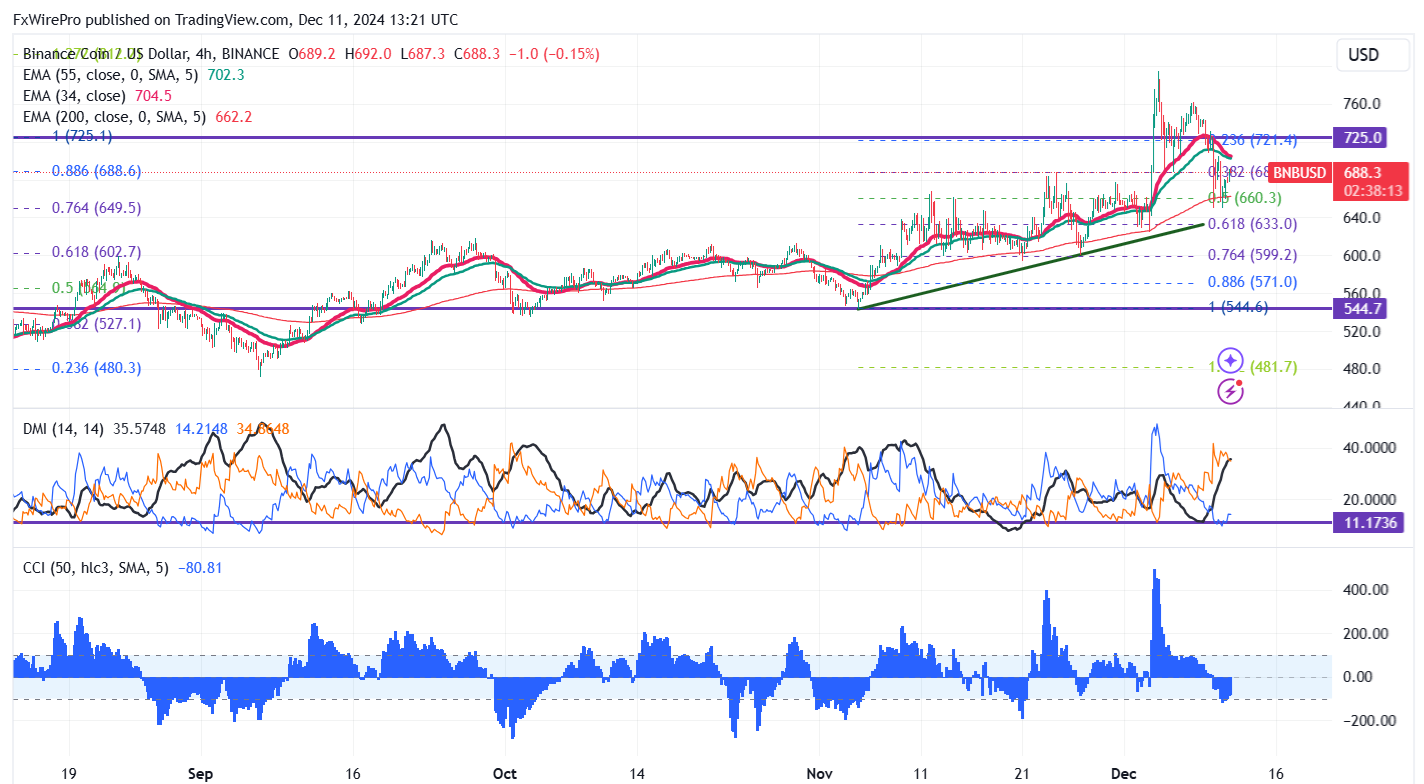
Key Level to Monitor: $640
BNB/USD pair formed a double bottom around $650 and showed a minor pullback. It hit a fresh all-time high $of 793 and is currently trading around $692.
Overall bias remains bullish as long as support of $640 holds. It trades above the 34 and 55 EMA on the 4-hour chart. If the pair closes below $640, potentially leading to further declines towards $580/$550.
Immediate Resistance is at $725. A successful breakout above this resistance could suggest bullish momentum, with further gains possible towards $775/$812/$848/$1000.
Indicators (4-Hour Chart)
- Directional Movement Index: Bullish
- CCI (50): Bullish
Trading Strategy
Consider buying on dips around $650, with a stop-loss set at $600 and a target price of $1000.


