BNB Trade Idea
Key Level to Monitor: $660
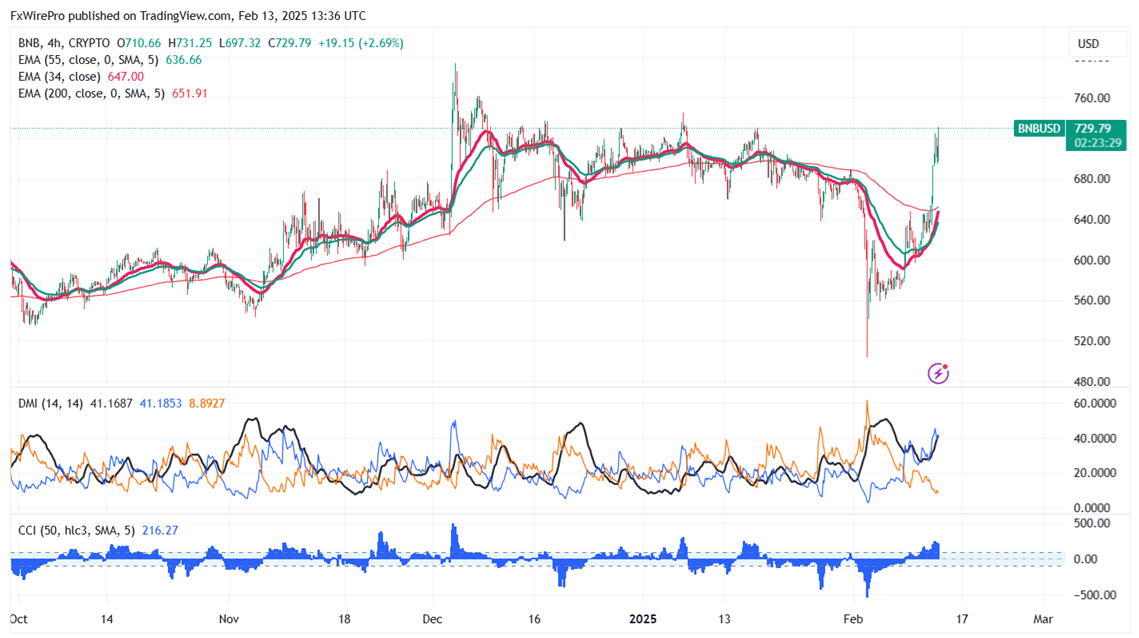
BNB/USD pair showed a minor pullback after forming a minor bottom around $596. It hit an intraday high of $645 and is currently trading around $642.
Overall bias remains bullish as long as support of $500 holds. It trades above the 34 and 55 EMA on the 4-hour chart. If the pair closes below $590, potentially leading to further declines towards $580/$550/$500.
Immediate Resistance is at $660. A successful breakout above this resistance could suggest bullish momentum, with further gains possible towards $700/$725/$775/$812/$848/$1000.
Indicators (4-Hour Chart)
- Directional Movement Index: Bullish
- CCI (50): Bullish
Trading Strategy
Consider buying on dips around $600 with a stop-loss set at $500 and a target price of $1000.



Ether Breaks Below $2,100: Triple EMA “Sell-the-Rally” Setup Targets $1,900
FxWirePro: USD/ZAR slips as SARB delivers surprise rate hike
Bitcoin Cracks $75K as $1.3B ETF Exodus and Middle East Jitters Spook Bulls; Bears Eye $70K
FxWirePro- Major Crypto levels and bias summary
USD/CHF Smashes Higher to 0.7899 on Dollar Dominance—Bulls Bet on 0.7865 Dips for 0.8000 Breakout
Bitcoin Bleeds $704M in ETF Outflows as Institutional Exodus Accelerates
Ethereum Tumbles Below $2K: Bears Eye $1,700 as All Key EMAs Flip Red
Pound-Yen Roars Back Above 214: Bulls Reload for 216–217 Charge on Dip-Buying Setup
FxWirePro: GBP/USD recovers some ground but bears are not done yet
FxWirePro: GBP/AUD downside pressure builds, key support level in focus
FxWirePro: EUR/AUD downward momentum remains in place 


