


 FxWirePro: AUD/USD remains buoyant, looks to extend gains
  FxWirePro- Major Crypto levels and bias summary
  FxWirePro: NZD/USD steadies around 0.5830,retains bid tone
  FxWirePro: NZD/USD trades in narrow range ,outlook bullish
  JPY Action Bias: Extremely Bullish Surge Ignites Across NZD, GBP & AUD
  GBPJPY Bullish on Consolidation: Holds Above 216 After 218 Top – Buy Dips at 217 Targeting 220
  FxWirePro: GBP/USD hits one-month high, scope for further upside
  FxWirePro- Woodies pivot (Major)
  FxWirePro- Woodies pivot (Major)
  Crypto Major Pair Action Bias: ETHUSD Bullish as BTCUSD, SOLUSD & XRPUSD Stay Neutral
  ETHUSD Bullish Momentum: Follows BTC Above All EMAs, Buy Dips Near $1750 Targeting $2300


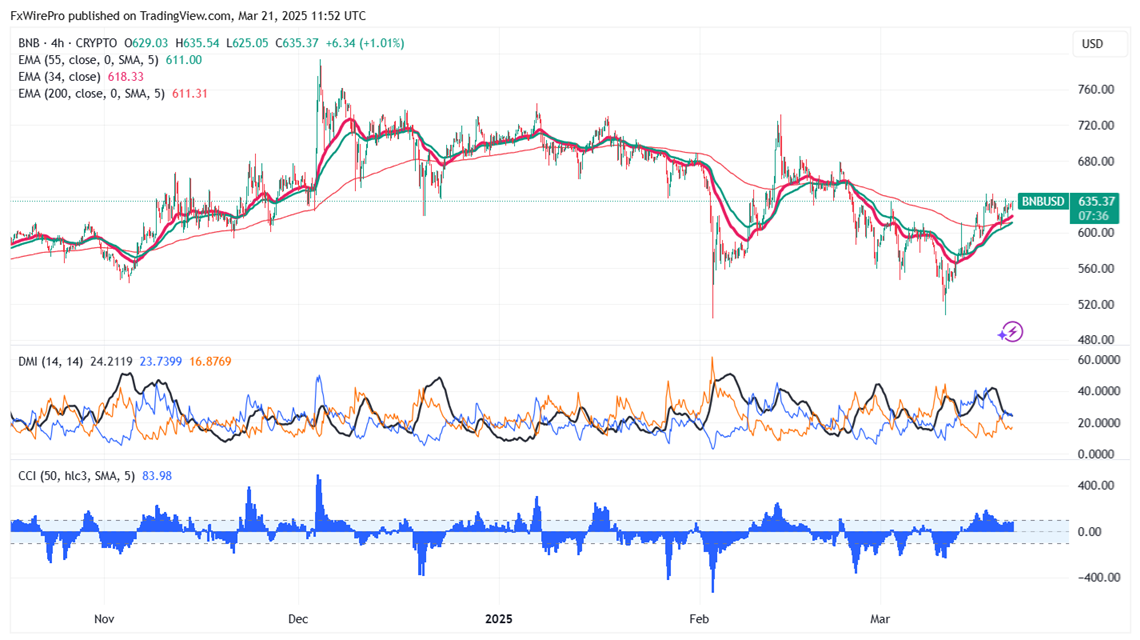
BNB/USD showed a minor pullback after taking support near 55-4H EMA. It hit a high of $643.90 and is currently trading around $634.
Overall bias remains bullish as long as support $500 holds. It trades above the 34 and 55 EMA on the 4-hour chart. If the pair closes below $500, potentially leading to further declines towards $400.
Immediate Resistance is at $645. A successful breakout above this resistance could suggest bullish momentum, with further gains possible towards $678/$700/$730.
Indicators (4-Hour Chart)
- Directional Movement Index: Neutral
- CCI (50): Bullish
Trading Strategy
It is good to buy on dips above $645 with a stop-loss set at $600 and a target price of $730.


