


 FxWirePro: USD/CAD falls after BoC rate hold and weak U.S. producer inflation
  ETH Stands Alone Bullish; BTC, SOL, XRP, BNB Neutral
  FxWirePro- Woodies pivot (Major)
  FxWirePro- Major Crypto levels and bias summary
  EUR/USD Holds Bullish Tone Despite Pullback from Yesterday’s High
  Crypto Major Pair Action Bias: ETHUSD Bullish as BTCUSD, SOLUSD & XRPUSD Stay Neutral
  FxWirePro: AUD/USD edges lower, but bullish outlook persists
  FxWirePro:EUR/NZD dips below lower range, bearish bias increases


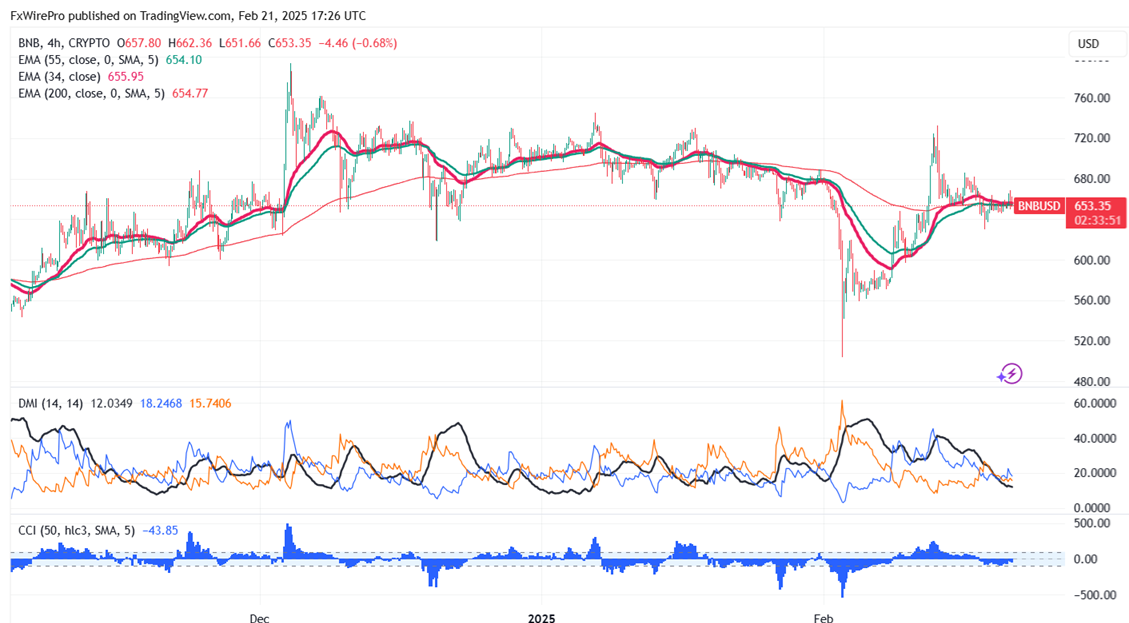
Key Level to Monitor: $660
BNB/USD pair lost its shine after forming a minor top of $732. It hit an intraday low of $630 and is currently trading around $651.75.
Overall bias remains bullish as long as support of $500 holds. It trades above the 34 and 55 EMA on the 4-hour chart. If the pair closes below $590, potentially leading to further declines towards $580/$550/$500.
Immediate Resistance is at $730. A successful breakout above this resistance could suggest bullish momentum, with further gains possible towards $775/$812/$848/$1000.
Indicators (4-Hour Chart)
- Directional Movement Index: Neutral
- CCI (50): Bearish
Trading Strategy
Consider buying on dips around $630 with a stop-loss set at $590 and a target price of $1000.


