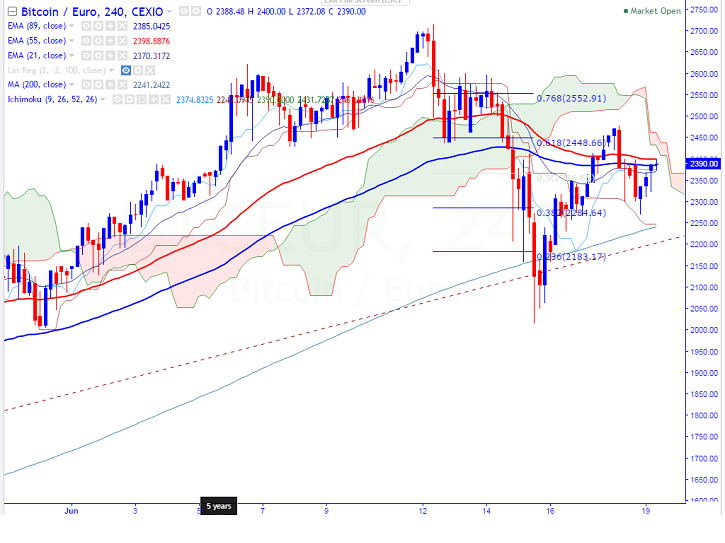
BTC/EUR has shown a minor dip after hitting a high of 2471 on Jun 18th (CEXIO). The pair formed a minor bottom around 2015 and is currently trading around 2390 at press time.
Ichimoku analysis of 4-Hour chart indicates:
Tenkan-Sen level: 2374
Kijun-Sen level: 2247
Major reversal level -2237 (200- 4H MA)
Long-term trend remains to be bullish. BTC/EUR forms temporary top around 2715 and any further bullish continuation can be seen only above that level.
Major resistance is around 2448 (61.8% retracement of 2716 and 2015) and any break above will take the pair to next level till 2471 (Jun 18th high)/2552/2716 (Jun 12th 2017 high)/ 2791 (113% retracement of 2716 and 2160). Short term support is seen at 1990 (76.4% retracement of 2716 and 2015) and any break below will drag the pair down till 1770 (May 27th 2017 low)/1500.
In the 4H chart RSI has shown a break out and so a slight bullishness can be seen.
It is good to buy on dips around 2325-2330 with SL around 2230 for the TP of 2600/2715.