


 Bitcoin Buckles at $73,500: Middle East Tensions and Weak Institutional Demand Set Bearish EMA Stack on $70K Collision Course
  Ethereum Tumbles Below $2K: Bears Eye $1,700 as All Key EMAs Flip Red
  FxWirePro- Major Crypto levels and bias summary
  Ether Breaks Below $2,100: Triple EMA “Sell-the-Rally” Setup Targets $1,900
  FxWirePro- Major Crypto levels and bias summary
  FxWirePro- Major Crypto levels and bias summary


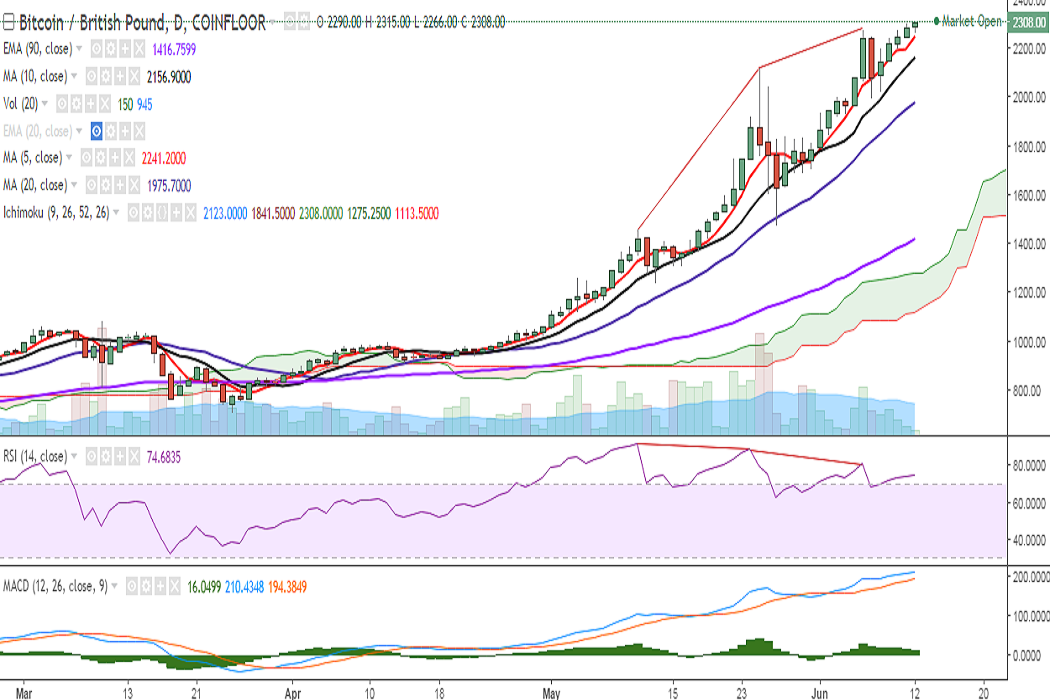
BTC/GBP broke above 2300 levels on Monday to hit a fresh all-time high at 2315 levels. It is currently trading at 2303 levels at press time (Coinfloor).
Ichimoku analysis of daily chart:
Tenkan Sen: 2123
Kijun Sen: 1841.50
On the upside, a close above 2300 levels would see the pair testing 2381 (113% extension of 1475 and 2277)/2411 (113% extension of 1240 and 2277)/2495.
Momentum studies appear bullish on the daily chart with RSI strong at 74, MACD line above the signal line, and the pair holding above 5-DMA.
However, caution is advised as RSI and Stochs are in the overbought zone. Also, bearish RSI divergence could be seen on the daily chart.
Support is seen at 2266 (1h 50-SMA) and a break below would see the pair testing 2240 (5-DMA)/2173 (2h 90-EMA)/2120 (10-DMA)/1975 (20-DMA).

- News

- Economy

- Central Banks
- Investing
- Research
- Roundups
- Digital Currency
- Insights
- Technical Analysis
- Technology
- Business
- Law
- Health
- Nature
- Fintech
- Science
- Topic
- Opinions
- ©Econometrics LLC . All Rights Reserved.
FxWirePro: BTC/GBP breaks above 2300, bias higher, stay long
Monday, June 12, 2017 9:58 AM UTC
Editor's Picks


- Market Data
Most Popular


