


 FxWirePro- Major Crypto levels and bias summary
  FxWirePro- Major Crypto levels and bias summary
  FxWirePro- Major Crypto levels and bias summary


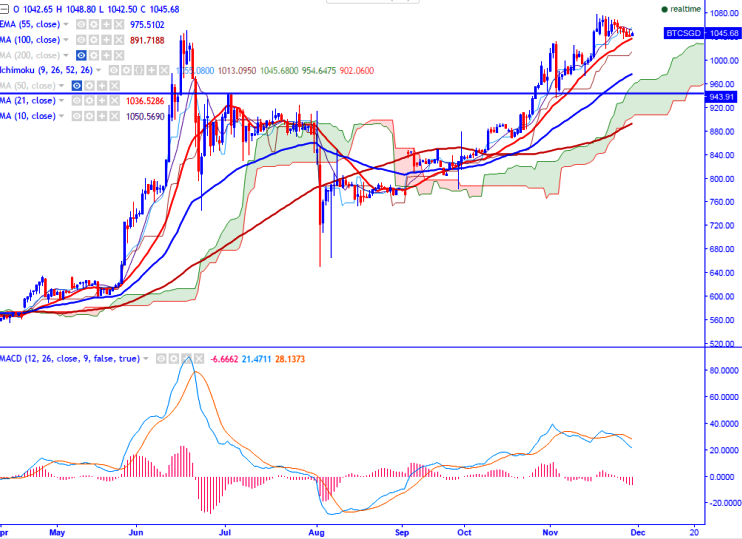
BTC/SGD is seen trading slightly above on Tuesday. The pair has formed a temporary top around 1079 and unable to break above that level (ITBIT). It is currently trading around 1047.30 at press time.
Ichimoku analysis of daily chart shows:
Tenkan-Sen level: 1047
Kijun-Sen level: 1007
Trend reversal level - (100 day MA) – 889
Long-term trend remains to be bullish. BTC/SGD downside is capped by 21-day MA at 1033. Any break below will take the pair to next level till 1020/1007.
Major resistance is around 1080 (Nov 17th, 2016 high) and any break above that level will take the pair to next level till 1090 (161.8% retracement of 1031.92 and 936.20)/1160 (127.2% retracement of 1051.92 and 650)/1204 (138.2% retracement of 1051.92 and 650). Short-term support is seen at 1033 (21- day MA) and any break below targets 1007 (daily Kijun-Sen)/973 (Nov 13th, 2016 low).

- News

- Economy

- Central Banks
- Investing
- Research
- Roundups
- Digital Currency
- Insights
- Technical Analysis
- Technology
- Business
- Law
- Health
- Nature
- Fintech
- Science
- Topic
- Opinions
- ©Econometrics LLC . All Rights Reserved.
FxWirePro: BTC/SGD faces strong support at 21-day MA, good to buy on dips
Tuesday, November 29, 2016 10:49 AM UTC
Editor's Picks


- Market Data
Most Popular


