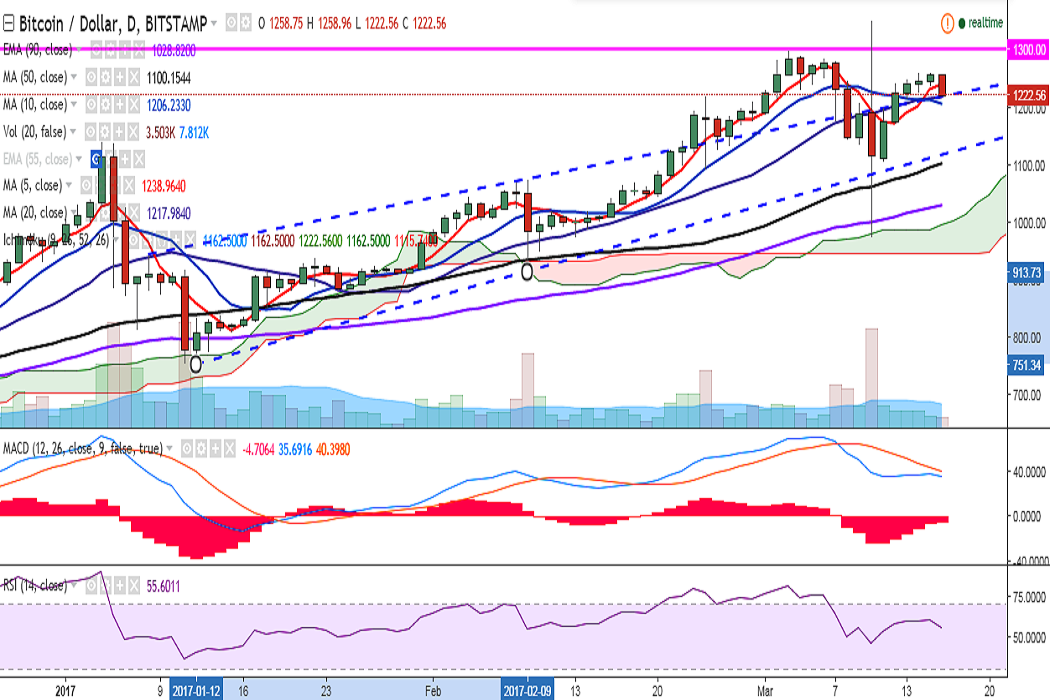
BTC/USD failed to break above 1260 levels and turned red on Thursday. It is currently trading at 1225 levels at press time (Bitstamp).
Ichimoku analysis of daily chart:
Tenkan Sen: 1162.50
Kijun Sen: 1162.50
On the topside, resistance is seen at 1260 (March 15 high) and a break above would see it testing 1298 (March 03 high) /1350 (March 10 high).
On the flipside, the pair has broken below 5-DMA and is currently holding above 1215.86 (20-DMA). Any violation would see minor bearishness in the pair, dragging it till 1168.99 (23.6% retracement of 751.34 and 1298)/1118 (trend line joining 751.34 and 913.73).