


 FxWirePro- Major Crypto levels and bias summary
  Ethereum Cracks Under $1,700: Sell the Rally Near $1,750 as Bears Eye $1,380–$1,200


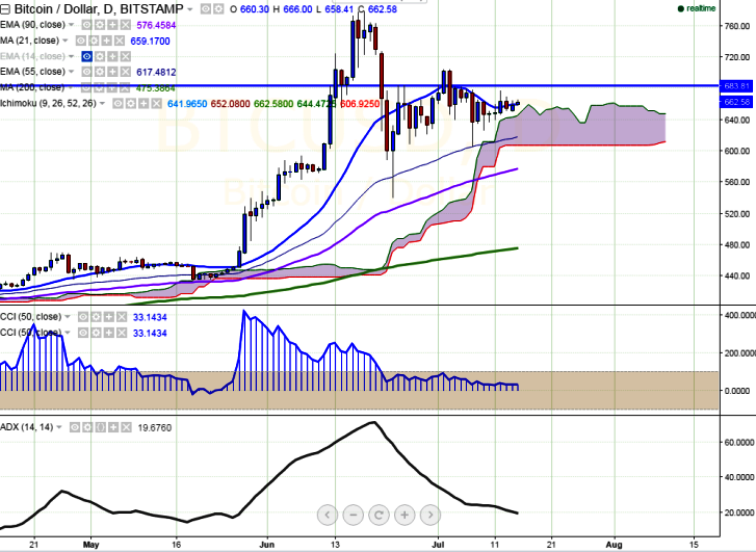
BTC/USD is consolidating in a narrow range between $678 and $650 for the past three trading session. It is currently trading at $661.55 levels (Bitstamp).
Long-term trend: Bullish
Short-term trend- Bullish
Ichimoku analysis (Daily chart):
Tenkan-Sen level: $642.25
Kijun-Sen level: $652.51
Trend reversal level - (90 EMA)-$574.50
“BTC/USD is facing strong resistance at $685 (Jun 25 high). It should break below this level for further bullishness”, FxWirePro said in a statement.
Major resistance is around $685 (Jun 25 high) and any break above targets $705 (Jul 2 high)/ $731 (161.8% retracement of $778 and $540). Short term support – $642 (daily Tenkan-Sen) and any violation below will drag the pair till $612 (55 day EMA)/$540 (Jun 23 low).

- News

- Economy

- Central Banks
- Investing
- Research
- Roundups
- Digital Currency
- Insights
- Technical Analysis
- Technology
- Business
- Law
- Health
- Nature
- Fintech
- Science
- Topic
- Opinions
- ©Econometrics LLC . All Rights Reserved.
FxWirePro: BTC/USD faces strong support at $650, good to buy on dips
Friday, July 15, 2016 7:39 AM UTC
Editor's Picks


- Market Data
Most Popular


