


 FxWirePro- Major Crypto levels and bias summary
  BTC’s Bear Bounce: Sell the Rally Near $66K as Bears Target $59K–$52K Breakdown


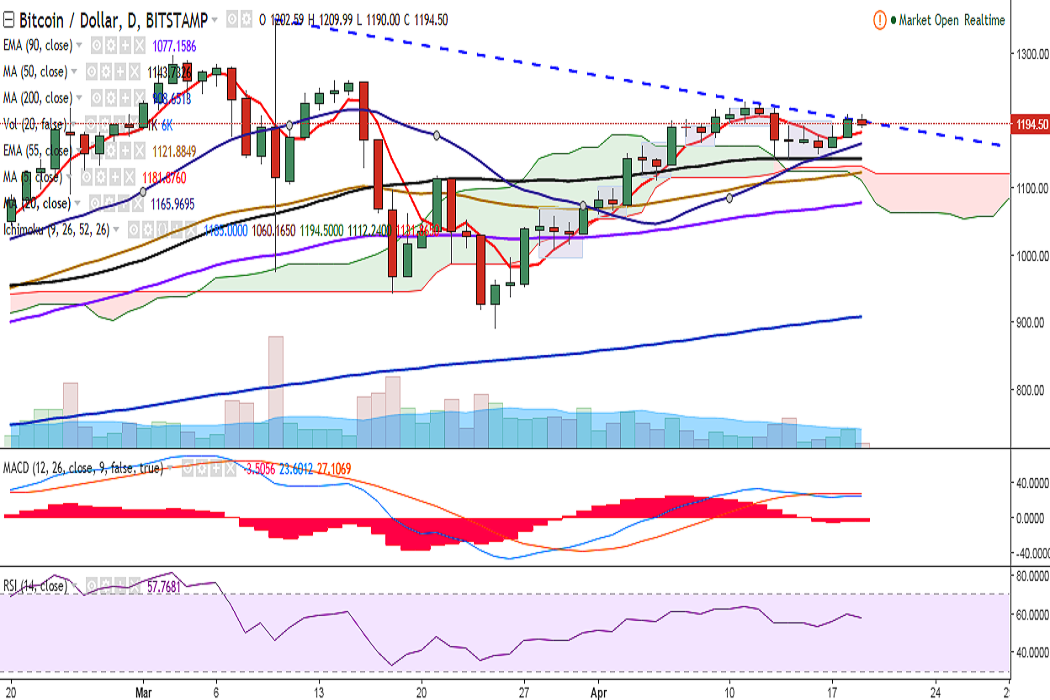
BTC/USD failed to close above trend line resistance on Tuesday. It is currently trading at 1190 levels at the time of writing (Bitstamp).
Ichimoku analysis of daily chart:
Tenkan Sen: 1185
Kijun Sen: 1060.16
The pair is facing strong resistance at 1200 (trend line joining 1350 and 1229) and only a close above will see further upside in the pair, targeting 1229 (April 11 high)/1260 (March 15 high).
In the daily chart, the pair is successfully holding above 5-DMA and momentum studies suggest scope for further bullish bias.
In the 4-hour chart, 1189.54 (4h 50-SMA) is acting as a major support and a break below would target 1165.94 (20-DMA)/1121 (55-EMA).

- News

- Economy

- Central Banks
- Investing
- Research
- Roundups
- Digital Currency
- Insights
- Technical Analysis
- Technology
- Business
- Law
- Health
- Nature
- Fintech
- Science
- Topic
- Opinions
- ©Econometrics LLC . All Rights Reserved.
FxWirePro: BTC/USD faces strong trend line resistance at 1200, break above to see further upside
Wednesday, April 19, 2017 9:17 AM UTC
Editor's Picks


- Market Data
Most Popular


