


 BTC’s Bear Bounce: Sell the Rally Near $66K as Bears Target $59K–$52K Breakdown
  FxWirePro- Major Crypto levels and bias summary
  Ethereum Cracks Under $1,700: Sell the Rally Near $1,750 as Bears Eye $1,380–$1,200
  FxWirePro- Major Crypto levels and bias summary
  FxWirePro- Major Crypto levels and bias summary


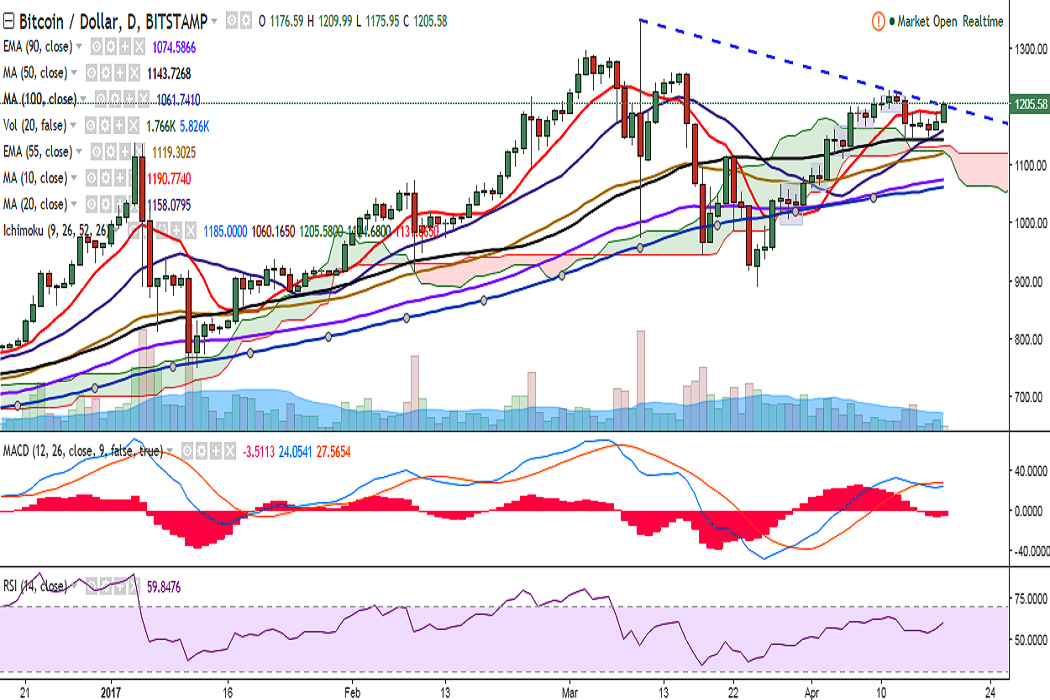
BTC/USD broke above 10-DMA on Tuesday and is currently holding its strength above this level. It is currently trading at 1204 levels (Bitstamp).
Ichimoku analysis of daily chart:
Tenkan Sen: 1185
Kijun Sen: 1060.16
On the upside, a close above 1205 (trend line joining 1350 and 1229) will see further upside in the pair, targeting 1229 (April 11 high)/1260 (March 15 high).
In the 4-hour chart, Bollinger band appears to be widening and the pair is hovering around upper Bollinger, suggesting further upside. In the daily chart, RSI is strong at 59, and stochs are biased higher. The pair is facing slight resistance around 1205 levels, but momentum studies suggest bullish bias.
The pair has taken support near 1158 (20-DMA) and any violation would drag it to 1143.73 (50-DMA)/1119.31 (55-EMA).

- News

- Economy

- Central Banks
- Investing
- Research
- Roundups
- Digital Currency
- Insights
- Technical Analysis
- Technology
- Business
- Law
- Health
- Nature
- Fintech
- Science
- Topic
- Opinions
- ©Econometrics LLC . All Rights Reserved.
FxWirePro: BTC/USD faces trend line resistance at 1205, bias higher, good to go long on dips
Tuesday, April 18, 2017 9:10 AM UTC
Editor's Picks


- Market Data
Most Popular


