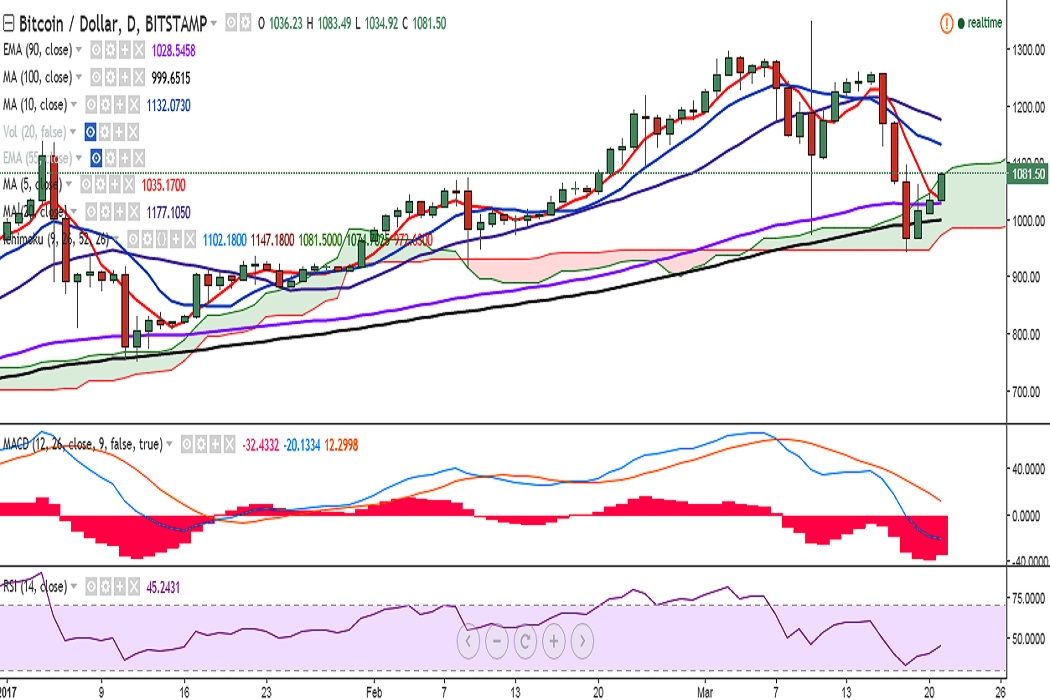
FxWirePro: BTC/USD hovers around cloud top at 1080, break above targets 1100/1140
BTC/USD moved further north on Tuesday and is currently trading at 1080 levels at press time (Bitstamp). Ichimoku analysis of daily chart: Tenkan Sen: 1102.18 Kijun Sen: 1147.18 The pair is currently hovering around 1080…
By Shampa Mani
Updated 1 min read
Image from the original EconoTimes article
BTC/USD moved further north on Tuesday and is currently trading at 1080 levels at press time (Bitstamp).
Ichimoku analysis of daily chart:
Tenkan Sen: 1102.18
Kijun Sen: 1147.18
The pair is currently hovering around 1080 levels (Cloud top) and a consistent break above would run into resistance at 1099 (38.2% retracement of 1350 and 944.36)/1141.57 (10-DMA).
On the flipside, the pair has taken support near 1027.35 (90-EMA) and a break below would see a dip till 996.52 (100-DMA)/944.36 (March 18 low). Further weakness would confirm bearishness in the pair.
Market pricing gave Solana (SOL) a 1% chance of reaching $190 by Oct. 31; September tokenized-stock trading on Solana topped $4.4 billion, a monthly record.