


 Bitcoin Cracks $75K as $1.3B ETF Exodus and Middle East Jitters Spook Bulls; Bears Eye $70K
  Ethereum Cracks Below $2,000 as Bitcoin Contagion Bites—Bearish EMA Stack Sets Sights on $1,700
  Ethereum Tumbles Below $2K: Bears Eye $1,700 as All Key EMAs Flip Red
  FxWirePro- Major Crypto levels and bias summary
  Bitcoin Bleeds $704M in ETF Outflows as Institutional Exodus Accelerates
  ETH Cracks $2,100 in Bitcoin’s Wake as Bearish EMA Stack Deepens; Sellers Target $1,900 on Rallies
  FxWirePro- Major Crypto levels and bias summary
  FxWirePro- Major Crypto levels and bias summary


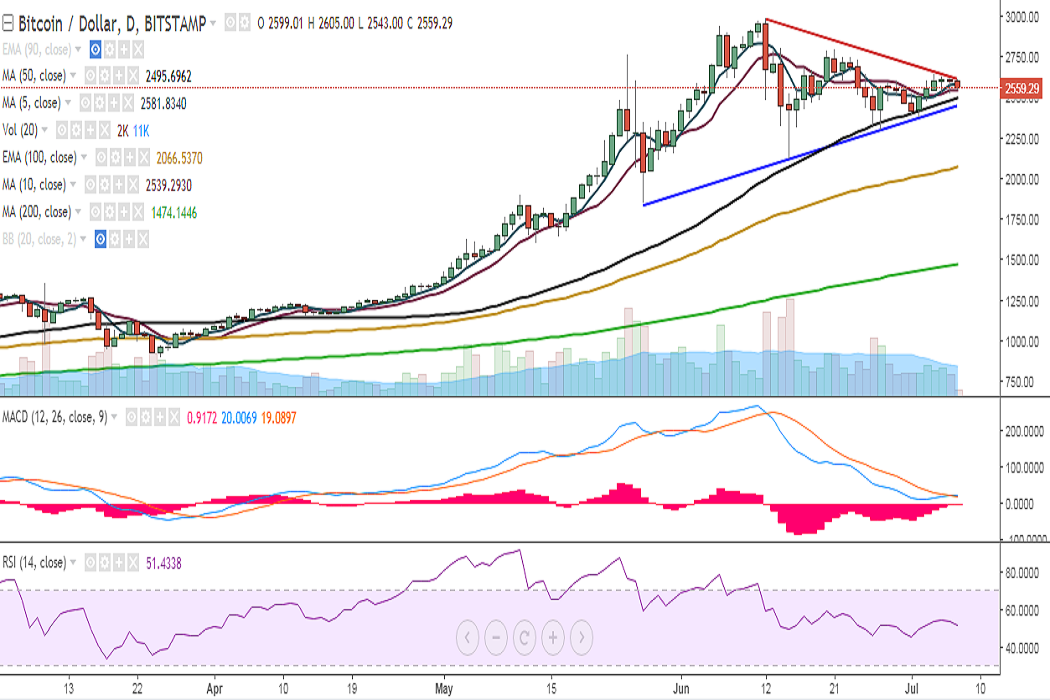
BTC/USD continues trading in a narrow range on Friday as it struggles to break above 4h 200-SMA. It is currently trading at 2555 levels at the time of writing (Bitstamp).
Ichimoku analysis of daily chart:
Tenkan Sen: 2506.90
Kijun Sen: 2550
On the upside, the pair faces strong resistance at 2620 (4h 200-SMA) and a consistent break above would see it testing 2651 (61.8% retracement of 2980 and 2120)/2682 (78.6% retracement of 2789 and 2291). Further strength would see it testing 2760 (May 25)/ 2789 (June21 high)/2853.
On the downside, support is seen at 2538 (10-DMA) and any violation would target 2495 (50-DMA)/2432 (trend line joining 1850 and 2120). Further weakness would drag it to 2374 (July 02 low).
Momentum studies: On the daily chart, RSI is at 51, with lower bias; MACD appears flat.
Bias appears weak on the 4-hour chart with RSI at 47, MACD line below the signal line and stochs biased lower.
On the weekly chart, the pair is struggling for a decisive break above 5-SMA. However, RSI continues to hold above 70 and MACD line is above the signal line.
Recommendation: Wait for clear directional bias.
FxWirePro launches Absolute Return Managed Program. For more details, visit http://www.fxwirepro.com/invest

- News

- Economy

- Central Banks
- Investing
- Research
- Roundups
- Digital Currency
- Insights
- Technical Analysis
- Technology
- Business
- Law
- Health
- Nature
- Fintech
- Science
- Topic
- Opinions
- ©Econometrics LLC . All Rights Reserved.
FxWirePro: BTC/USD remains rangebound, bias neutral
Friday, July 7, 2017 9:39 AM UTC
Editor's Picks


- Market Data
Most Popular


