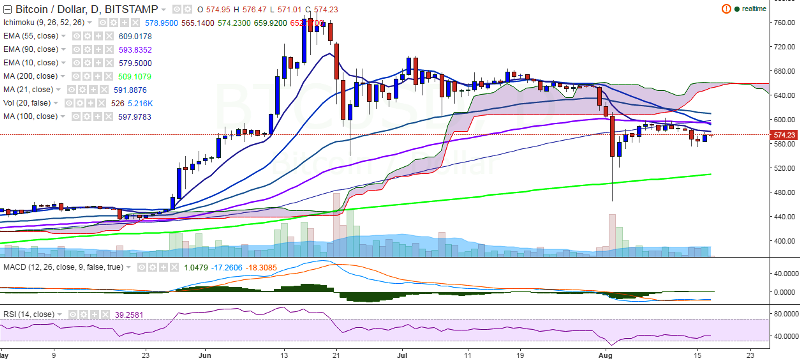
BTC/USD reversed the downward spell on Tuesday and hit 579.80 levels, before closing at 574.99 levels. On Wednesday, the pair is trading in a narrow range between 571 and 576 levels (Bitstamp).
Ichimoku analysis of daily chart:
Tenkan Sen: 578.95
Kijun Sen: 565.79
Trend reversal: 594.27 (90 EMA)
On the topside, BTC/USD faces major resistance at 595.66 (21-day MA) and break above would target 611.61 (55 EMA)/659.07 (61.8% retracement of 778.85 and 465.28. On the flipside, support is seen at 534.14 (50% retracement of 465.25 and 603) and violation of this level will take the pair to 508.11 (200-day MA)/465.28 (August 2 low).


FxWirePro- Major Crypto levels and bias summary
Bitcoin Cracks $75K as $1.3B ETF Exodus and Middle East Jitters Spook Bulls; Bears Eye $70K
ETH Cracks $2,100 in Bitcoin’s Wake as Bearish EMA Stack Deepens; Sellers Target $1,900 on Rallies
Ethereum Cracks Below $2,000 as Bitcoin Contagion Bites—Bearish EMA Stack Sets Sights on $1,700
Ether Breaks Below $2,100: Triple EMA “Sell-the-Rally” Setup Targets $1,900
Ethereum Tumbles Below $2K: Bears Eye $1,700 as All Key EMAs Flip Red
Bitcoin Buckles at $73,500: Middle East Tensions and Weak Institutional Demand Set Bearish EMA Stack on $70K Collision Course
FxWirePro- Major Crypto levels and bias summary


