


 Ethereum Cracks Under $1,700: Sell the Rally Near $1,750 as Bears Eye $1,380–$1,200
  FxWirePro- Major Crypto levels and bias summary


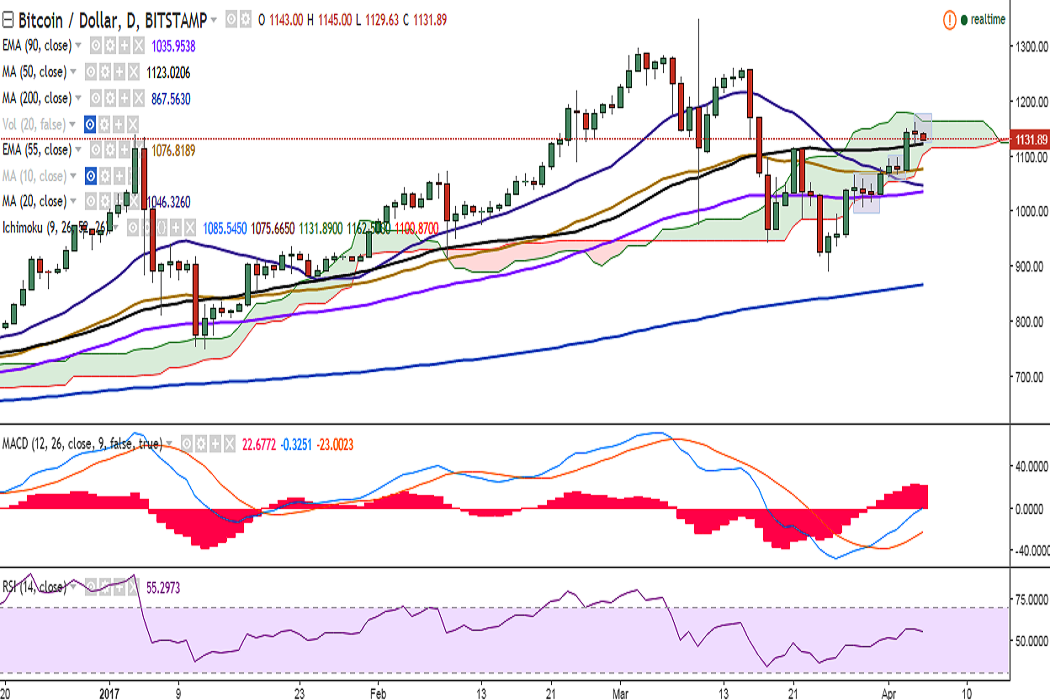
BTC/USD is trading in the red on Wednesday and holding just above 50-DMA at 1130 levels at the time of writing (Bitstamp).
Ichimoku analysis of daily chart:
Tenkan Sen: 1085.54
Kijun Sen: 1075.66
A flag pattern could be seen in the daily charts and a break above Cloud top will see further bullishness in the pair. We could see some consolidation around current levels. Traders are advised to wait for clear signal on the daily charts.
On the upside, resistance is seen at 1162.50 (Cloud top) and a break above would see it testing 1190 (113% retracement of 1139.89 and 751.34)/1220 (February 24 high).
On the downside, support is seen at 1123 (50-DMA) and a break below would drag it to 1100 (Cloud base)/1076.88 (55-EMA).

- News

- Economy

- Central Banks
- Investing
- Research
- Roundups
- Digital Currency
- Insights
- Technical Analysis
- Technology
- Business
- Law
- Health
- Nature
- Fintech
- Science
- Topic
- Opinions
- ©Econometrics LLC . All Rights Reserved.
FxWirePro: BTC/USD takes support near 50-DMA, break below to see minor bearishness
Wednesday, April 5, 2017 7:31 AM UTC
Editor's Picks


- Market Data
Most Popular


